
Published on October 29, 2025 1:37 AM GMT
by Bruno Lopez Orozco, Jesus Tadeo Cruz Soto, Miguel Angel Peñaloza Pérez
Language models have made tremendous progress in their ability to solve mathematical problems, but how do we really know how well they're doing? It's not enough to just check if the final answer is correct; we need to understand how they got there and where they're falling short.
What Others Have Discovered
Recent research has revealed fascinating patterns about these models' limitations:
The Weaknesses of Current Models
Burnham (2025) conducted an in-depth analysis of the Grok 4 model and discovered something interesting: while the model can solve complex high school-level problems, it has a clear weakness in spatial intuition. Problems requiring abstraction and creativity remain its Achilles' heel.
Three Common Types of Errors
Parra et al. (2024) identified three fundamental error categories when working with models like GPT-3.5 and Bard:
- Construction errors: The model doesn't correctly represent geometric elements on the planeConceptual errors: Applies properties without verifying necessary conditions, mixes units of measurement, or omits crucial informationContradictions: The reasoning steps contradict each other
Structured Step-by-Step Evaluation
Wang et al. (2025) proposed a more systematic approach with five evaluation dimensions: final answer correctness, step completeness, step validity, intermediate calculation accuracy, and problem comprehension. Their main findings: models tend to omit key steps, fail at unit conversions, misinterpret concepts, and make basic arithmetic errors.
Liu et al. (2025) went further, modeling the evaluation process according to human cognitive stages: problem understanding, problem solving, and problem summarization. Their nine evaluation dimensions capture everything from linguistic details to mathematical conceptual mastery.
Our Approach: Five Core Criteria
For this evaluation, we developed a system based on five key constructs, each assessed on a Likert scale from 1 (deficient) to 4 (excellent):
Evaluation Dimensions | ||||
| Criteria | Level 4 Excellent (4 points) | Level 3 Adequate (3 points) | Level 2 Insufficient (2 points) | Level 1 Deficient (1 point) |
| Reasoning and Justification | Presents coherent and well-founded, solid arguments, outlining intermediate steps and demonstrating deep understanding of logic and justification in behaviors and decisions. | Presents adequate reasoning, although there may be minor gaps or omissions in logic. Shows solid understanding, although some steps may be less clear or complete. | Presents important errors in reasoning or explanation. Some arguments may be superficial, with deficient analysis. | The presented arguments are inconsistent or inadequate. Shows little understanding of a logical approach. |
| Clarity and Coherence in Explanation | The solution is well-organized, steps are clearly presented, arguments are precise and easy to follow. Uses appropriate language correctly and maintains conceptual coherence. | The solution is comprehensive overall, but may need some clarifications or improvements in explanation with sufficient clarity. | The solution is poorly structured or difficult to follow. There may be important errors in the method or structure used. | The solution is very disorganized or incomprehensible. Steps do not follow a logical order and it's not possible to understand the logic used. |
| Creativity and Procedure | Uses an original and well-structured procedure or approach. Shows creativity in approach or an original or ingenious method to solve the problem optimally. | The procedure is correct and adequate. Follows established steps logically, although it may be less creative. May present some minor errors or omissions. | There are important errors in the procedure or mathematical method used. The approach is unclear or inefficient. | Does not follow an adequate procedure or the approach used is incorrect. Does not follow any logical procedure or sequence. |
| Correct Use of Notation and Mathematical Language | Uses appropriate terms and mathematical operations throughout the solution. No notation errors, and mathematical writing is clear and correct. | Mostly correct use of notation and mathematical terminology. Some minor errors are present that do not significantly affect comprehension. | Several errors in mathematical notation or incorrect interpretation of symbols or expressions. | Incorrect or deficient use of mathematical notation and terminology. Shows a deficient understanding of mathematical language. |
| Complete Problem Development | Develops the problem step by step until clearly reaching the required final answer. No step is omitted, and everything is calculated correctly. | Presents complete development, but may lack some steps or detailed results. The final answer is essentially correct, although it may present minor calculation errors. | The development is incomplete, with important failures or errors that affect the validity of the result. May present minor errors in calculation. | Does not develop the problem or only presents scattered fragments of the solution. Does not achieve a coherent or valid result. |
Testing the Best Models
We evaluated six state-of-the-art models (Claude, DeepSeek V3, Llama 70B, Grok-3, Grok-4, and o3-mini) using problems from the AI4MATH Challenge benchmark. All models were configured in Chain of Thought mode to analyze their step-by-step reasoning capabilities.
We evaluated 105 responses using GPT-4-Turbo as the evaluator (with temperature 0.7 to maintain consistency). This gave us a broader view of performance patterns.
Multiple Correspondence Analysis: Finding Hidden Patterns
To make sense of all this qualitative information, we applied Multiple Correspondence Analysis (MCA). This unsupervised learning technique allows us to visualize patterns in multi-category data.
What are we looking for? Relationships between the five evaluation criteria, the evaluated model, the mathematical area of the problem, and whether the answer was correct or incorrect.
Interpreting the Relationships
MCA reveals fascinating associations:
- If two categories are close in space and have high coordinates, they're directly associatedIf they're far apart but with high coordinates, they have an inverse relationshipCategories in the same dimensional direction are statistically related
These patterns help us understand, for example, whether certain models tend to fail in specific mathematical areas, or if there are types of errors that correlate with deficiencies in particular criteria.
This research goes beyond simply grading correct or incorrect answers. It helps us understand the real capabilities and limitations of language models in mathematical reasoning, identify specific error patterns, and ultimately improve these systems to make them more reliable tools in education and problem-solving.
Decoding the Statistical Measures: What We're Actually Reporting
In our MCA results, we'll be reporting several key statistical measures. Let's break down what each one means so you can fully understand what the numbers are telling us:
Loadings (Coordinates) Think of loadings as GPS coordinates on our quality map. Each model, domain, or performance category gets coordinates that tell us where it sits in the multidimensional space. A loading of -0.782 versus +1.902 isn't just about magnitude—the sign (positive or negative) tells us which "side" of the dimension the category falls on. Categories with similar signs are related; opposite signs suggest inverse relationships.
Explained Variance This tells us how much of the total variability in our data each dimension captures. If Dimension 1 explains 17.49% of variance, it means that axis accounts for about one-sixth of all the differences we see between responses. The more variance explained, the more important that dimension is for understanding the overall patterns.
Eigenvalues These are the raw mathematical power behind each dimension. An eigenvalue of 0.59 tells us the strength of that dimension in separating our categories. Larger eigenvalues indicate dimensions that do more "work" in differentiating between groups. In MCA, we typically look at dimensions with eigenvalues above certain thresholds to decide which dimensions are worth interpreting.
Cos² (Quality of Representation) This is arguably the most practical measure—it tells us how well a specific dimension represents a particular category. A cos² of 48% for "Reasoning Deficient" on Dimension 2 means that dimension captures 48% of that category's information. High cos² values (above 0.3 or 30%) indicate that the category is strongly associated with that dimension and should be interpreted in that context. Low cos² values mean the category isn't well-represented by that dimension and might be better explained by other dimensions.
Think of cos² as a "confidence score"—how confident can we be that a dimension is relevant for understanding a particular category?
What We Found: The Results Tell a Story
Understanding the Analysis Framework
Before diving into the results, let's understand what Multiple Correspondence Analysis (MCA) actually does. Think of it as creating a map where similar things cluster together. In our case, we're mapping 6 AI models, 6 mathematical domains, review statuses, and multiple performance criteria rated on a 4-point scale. The goal? To see which models perform similarly, which mathematical areas are problematic, and how different quality dimensions relate to each other.
The Big Picture: Variance and Complexity
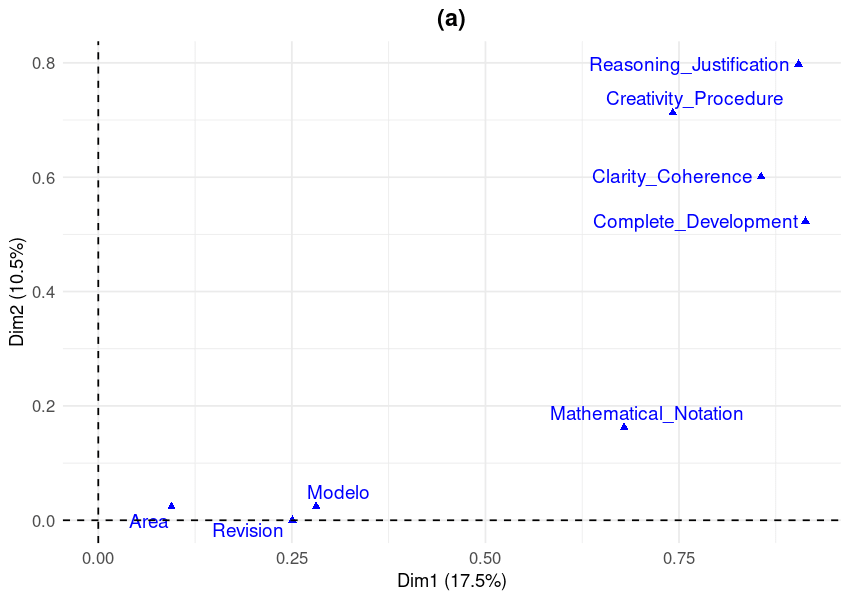
Figure 1. MCA biplot of evaluation criteria across dimensions 1 (17.5% variance) and 2 (10.5% variance). Proximity between points indicates association strength. Dim1 captures overall performance quality; Dim2 captures reasoning quality variation. Points represent category centroids for AI models (Modelo), mathematical domains (Area), review status (Revision), and performance evaluation criteria. For complete statistical details, including all loadings, eigenvalues, and cos² values, please refer to the supplementary material tables.
Our MCA extracted the first two dimensions, which together explained 28% of the total variance:
- Dimension 1: 17.49% (eigenvalue = 0.59)Dimension 2: 10.54% (eigenvalue = 0.356)
What does 28% variance mean? You might think, "Only 28%? That seems low!" But here's the thing—this relatively modest percentage is actually telling us something profound: there's extraordinary heterogeneity in our data.
Think of it this way: if we could explain 80-90% of the variance with just two dimensions, it would mean the relationships are simple and predictable—models would fall into neat categories like "good" and "bad." But mathematical reasoning isn't that simple. The 28% tells us that the relationships between AI models and evaluation criteria are incredibly complex and multifaceted. Different models excel in different ways, struggle with different problems, and show unique patterns that can't be reduced to a simple "Model A is better than Model B" ranking.
Which Models Drive the Variation?
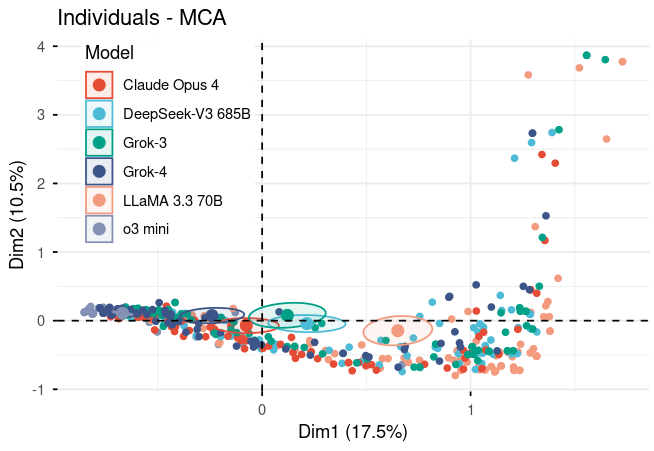
Figure 2. MCA scatter plot of 105 individual model responses across dimensions 1 (17.5%) and 2 (10.5%). Each point represents one response, colored by model. Dim1 captures overall quality; Dim2 captures reasoning variation. Clustering patterns reveal model-specific performance profiles, with some models showing more consistent responses (tight clusters) than others (dispersed points). Ellipses indicate response concentration areas. For complete statistical details including all loadings, eigenvalues, and cos² values, please refer to the supplementary material tables.
When we look at Dimension 1 (the primary axis of variation), two models immediately stand out:
Llama 70B: Contributing 14.4% (cos² value) o3-mini: Contributing 15.2% (cos² value)
These high contribution values mean these models are the most strongly associated with whatever Dimension 1 represents. They're the ones "pulling" the dimension in opposite directions, representing the extremes of the performance spectrum. In other words, when we talk about variation in how models perform, these two models are defining what "different" looks like.
Dimension 2 reveals something different. It's dominated by deficient performance in reasoning and justification, with a massive 48% cos² contribution. This means Dimension 2 is essentially a "quality detector"—it primarily captures whether responses are well-reasoned or poorly reasoned. If a model has a strong loading on Dimension 2, it's telling us about its tendency to produce either very strong or very weak reasoning.
Excellence vs. Deficiency: A Clear Divide
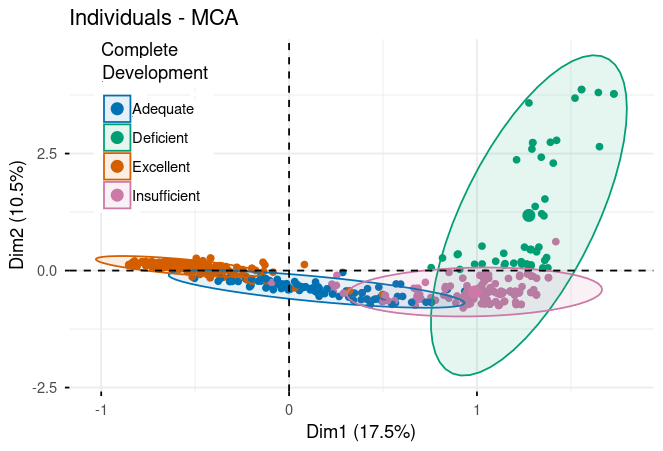


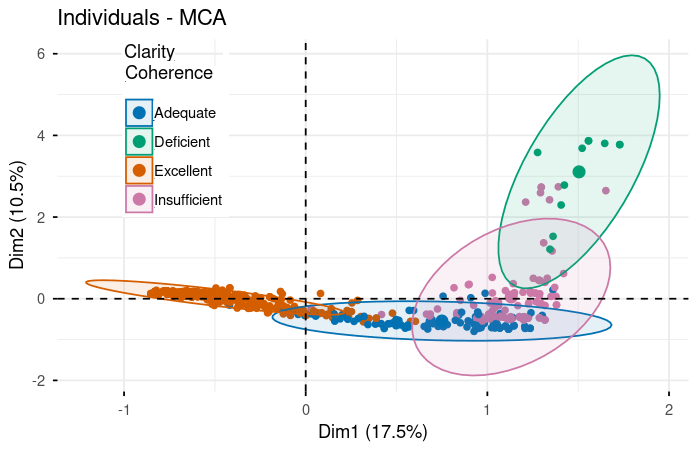
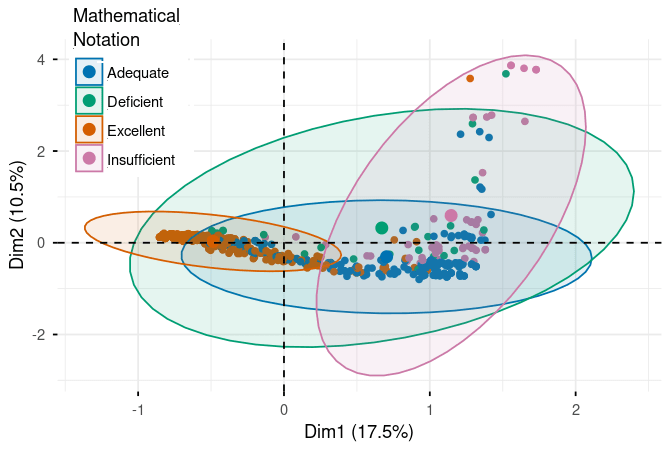
Figure 3. Performance rating distributions across evaluation criteria in MCA space (Dim1: 17.5%, Dim2: 10.5%). Five panels show responses colored by rating level (Excellent/Adequate/Insufficient/Deficient) for each criterion: Complete Development, Reasoning & Justification, Creativity & Procedure, Clarity & Coherence, and Mathematical Notation. Clear separation between Excellent (orange, left) and Deficient (teal, right/upper) ratings demonstrates framework validity. Ellipses indicate rating concentration areas. For complete statistical details including all loadings, eigenvalues, and cos² values, please refer to the supplementary material tables.
Here's where the analysis gets really interesting. When we plot all the performance categories, we see a striking pattern emerge.
The Excellence Cluster (Negative Loadings on Dimension 1):
- Reasoning & Justification (Excellent): -0.782Clarity & Coherence (Excellent): -0.648Complete Development (Excellent): -0.761
What does this negative clustering mean? In MCA, when categories have similar coordinate signs and cluster together, they're statistically related. So excellent performance across different criteria isn't happening independently—they move together. When a model produces excellent reasoning, it's also likely to produce excellent clarity and excellent development. These three dimensions of quality are intertwined.
The magnitude of these loadings (around -0.65 to -0.78) tells us these relationships are strong. Excellence is systematic, not random.
The Deficiency Cluster (Positive Loadings on Dimension 1):
- Reasoning & Justification (Deficient): 1.902Clarity & Coherence (Deficient): 1.959Creativity & Procedure (Deficient): 1.879
Notice the much larger magnitudes (1.8 to 2.0)! This is significant. Not only do deficient performances cluster together just like excellent ones, but they do so even more strongly. When a model struggles with reasoning, it tends to struggle dramatically with clarity and creativity as well. Poor performance cascades across multiple dimensions.
The stark contrast—excellent categories at -0.6 to -0.8 versus deficient categories at +1.8 to +2.0—creates what we call "clear separation" in the dimensional space. This validates that our evaluation framework has strong discriminatory power. We're not just making up distinctions; the data shows real, measurable differences between quality levels.
The Middle Ground:
The intermediate categories (Good and Regular) position themselves between these extremes, exactly as we'd expect if quality exists on a continuum. This validates the entire rating scale—it's not just "good" or "bad," but a genuine spectrum of performance.
Decoding Model Personalities on Dimension 1
Dimension 1 is fundamentally about overall performance quality. Let's see where each model sits:
The Extremes:
- Llama 70B (0.847): Strong positive loadingo3-mini (-0.827): Strong negative loading
These models occupy opposite ends of the spectrum. But here's what's crucial—they're not simply "best" and "worst." They're at opposite extremes, meaning they associate with different types of performance patterns. Based on the excellence/deficiency clustering we saw earlier:
- o3-mini's negative loading aligns with the excellence cluster, suggesting consistent high-quality outputsLlama 70B's positive loading aligns with the deficiency cluster, suggesting more frequent struggles
The Balanced Center:
- Claude (-0.099): Almost perfectly centeredDeepSeek V3 (0.279): Slightly positiveGrok-3 (0.157): Slightly positive
These models cluster near the origin (coordinate 0), which means they don't strongly associate with either extreme. They're the "balanced performers"—sometimes excellent, sometimes struggling, showing more variability and less predictable patterns. Their moderate loadings suggest mixed performance profiles rather than consistent excellence or deficiency.
What Dimension 2 Reveals About Model Behavior
While Dimension 1 captures overall quality, Dimension 2 appears to capture specific performance aspects or problem-solving styles:
Positive Loadings:
- Grok-4 (0.125)Grok-3 (0.130)
Negative Loadings:
- Llama 70B (-0.245)Claude (-0.120)
Remember, Dimension 2 is heavily influenced by reasoning quality variations. The Grok models' positive loadings might indicate specific reasoning approaches or tendencies, while Llama 70B and Claude's negative loadings suggest different problem-solving styles.
What's particularly interesting is that Grok-4, despite being from the same family as Grok-3, shows a unique signature. While Grok-3 clusters with the moderate performers on Dimension 1, Grok-4 has its own distinct position in the multidimensional space. This suggests meaningful architectural or training differences between model versions.
Mathematical Domains: The Terrain of Difficulty
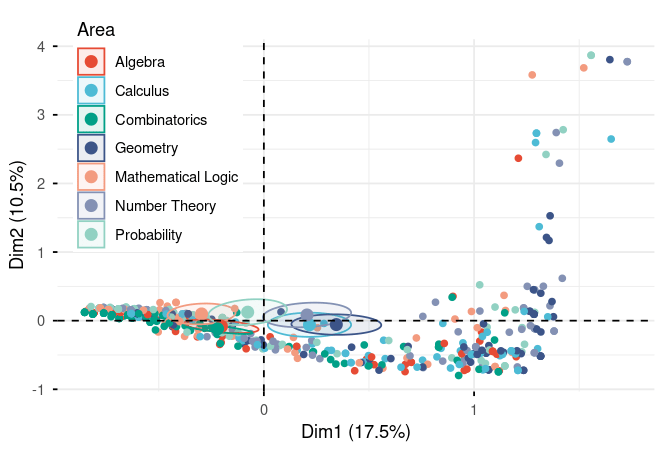
Figure 4. MCA scatter plot of responses by mathematical domain across dimensions 1 (17.5%) and 2 (10.5%). Each point represents one response, colored by area (n=7 domains). Geometry (dark blue) and Calculus (light blue) cluster toward positive Dim1 (lower performance), while Algebra (red), Mathematical Logic (coral), and Combinatorics (teal) trend toward negative Dim1 (higher performance). Wide spread across Dim2 indicates varied reasoning approaches within domains. For complete statistical details including all loadings, eigenvalues, and cos² values, please refer to the supplementary material tables.
Not all mathematics is created equal when it comes to AI performance. The MCA reveals fascinating patterns about which domains challenge models:
Positive Loadings on Dimension 1 (Associated with Deficiency):
- Geometry (0.449): Surprisingly challengingCalculus (0.282): Moderately difficult
Wait—geometry is difficult for AI? This aligns with Burnham's (2025) finding about spatial intuition limitations. Geometry requires visualizing shapes, understanding spatial relationships, and applying properties based on visual configurations—all areas where LLMs traditionally struggle.
Negative Loadings on Dimension 1 (Associated with Excellence):
- Mathematical Logic (-0.386): Models perform better hereCombinatorics (-0.287): Also relatively strongAlgebra (-0.262): Comfortable territory
This makes intuitive sense. Mathematical logic, combinatorics, and algebra are more symbolic and rule-based. They rely on formal manipulation of symbols and application of well-defined procedures—exactly what language models are trained to do through pattern recognition.
Dimension 2 Standout:
- Probability (0.208): Strongest positive loading on Dimension 2
Probability's unique position on Dimension 2 suggests it behaves differently from other domains. It might be that probability problems require a specific type of reasoning that doesn't fit neatly into the general quality spectrum captured by Dimension 1. Some models might excel at probabilistic reasoning while struggling elsewhere, or vice versa.
The Complete Picture
When we put all this together, we see a complex landscape:
- Quality is multidimensional: Excellence across criteria correlates strongly; so does deficiencyModels have distinct profiles: They don't just differ in "how good" they are, but in "how" they performMathematical domains vary systematically: Some areas are universally harder (geometry), others are more tractable (algebra, logic)Performance is context-dependent: A model's strength in one domain doesn't guarantee strength in another
What Does This All Mean?
Models Have Personalities, Not Just Performance Levels
The MCA reveals that AI models cluster into distinct performance profiles rather than following a simple "best to worst" ranking. This aligns perfectly with Burnham's (2025) findings about remarkable capability differences between LLMs.
Here's what the positioning suggests:
- Llama 70B and o3-mini emerge as models with the most distinct performance characteristics, though in different directions—they're the specialistsClaude, DeepSeek V3, and Grok-3 show more balanced, moderate performance profiles—the generalistsGrok-4 exhibits a unique performance signature distinct from all other models—the wild card
Domain Difficulty Isn't Universal
Mathematical domains don't uniformly associate with performance levels. Geometry and calculus appear more amenable to high-quality AI responses, while combinatorics and mathematical logic consistently challenge models. Crucially, this difficulty isn't uniform across all evaluation criteria—a model might excel at the reasoning aspect of a combinatorics problem but struggle with notation.
These domain-specific challenges were first reported by Hendricks et al. (2020) and further validated by Glazer et al. (2024), and our findings add another layer of granularity to this understanding.
This research goes beyond simply grading correct or incorrect answers. It helps us understand the real capabilities and limitations of language models in mathematical reasoning, identify specific error patterns, and ultimately improve these systems to make them more reliable tools in education and problem-solving.
Recommendations for Qualitative Evaluations and Future Experiments
The Foundation: Quality Evaluation Instruments
Here's something we need to talk about honestly—the cornerstone of qualitative analysis of language model responses lies in the evaluation instrument itself. In our case, that's the list of criteria we used to assess responses.
The Real Challenge
We believe that constructing these types of metrics is the main bottleneck and the most complicated part of developing this kind of analysis. Why? It requires specialized personnel with deep expertise in the task being evaluated. You can't just throw together a rubric and expect meaningful results—you need people who truly understand mathematical reasoning, pedagogical approaches, and the nuances of problem-solving to capture the real capabilities of these models.
It's not a one-and-done process either. You need multiple experiments to validate that your instrument actually captures what you think it captures. Does "excellent reasoning" mean the same thing across different evaluators? Does your rubric work equally well for algebra and geometry problems? These questions require rigorous testing and refinement.
The Path Forward: Validating Our Instruments
We strongly recommend that future projects focus on validating qualitative evaluation instruments for language models. There are several powerful methodological approaches worth exploring:
Factorial Analysis. This could help us understand whether our five evaluation criteria really represent distinct dimensions of performance, or if some criteria are actually measuring the same underlying construct. Maybe "clarity" and "complete development" are so correlated that they're essentially one dimension?
Item Response Theory (IRT). This is where things get really interesting. IRT could help us understand not just how models perform, but how difficult different problems are and how discriminating our evaluation criteria are. Some criteria might be excellent at distinguishing between moderate and good performance, but useless for separating good from excellent. IRT can reveal that.
Structural Equation Modeling (SEM). This more robust approach would let us test complex relationships between variables. For example, does mathematical domain difficulty affect model performance through reasoning ability, or does it have a direct effect? SEM can model these intricate pathways.
Why This Matters for the Field
As language models continue to improve, our evaluation methods need to evolve alongside them. The qualitative evaluation framework we've used here is a starting point, but the field needs:
- Standardized, validated evaluation instruments that different researchers can use and comparePsychometric validation of these instruments to ensure they're reliable and meaningfulDomain-specific rubrics that account for the unique challenges of different mathematical areasCross-model benchmarking using consistent, validated criteria
The work of understanding AI capabilities isn't just about building better models—it's equally about building better ways to evaluate them.
References
Hendrycks, D., Burns, C., Basart, S., Zou, A., Mazeika, M., Song, D., and Steinhardt, J.
(2020). Measuring massive multitask language understanding. https://doi.org/10.48550/arXiv.2009.03300.
Glazer, E., Erdil, E., Besiroglu, T., Chicharro, D., Chen, E., Gunning, A., Olsson, C.,
Denain, J., Ho, A., Santos, E., et al. (2024). Frontiermath: A benchmark for evaluating
advanced mathematical reasoning in ai. https://arxiv.org/abs/2411.04872.
Greg Burnham (2025), "Evaluating Grok 4’s Math Capabilities". Published online at epoch.ai. Retrieved from: 'https://epoch.ai/blog/grok-4-math' [online resource]
Parra, V., Sureda, P., Corica, A., Schiaffino, S., & Godoy, D. (2024). Can generative AI solve geometry problems? Strengths and weaknesses of LLMs for geometric reasoning in Spanish. https://revistas.unir.net/index.php/ijimai/article/view/334/168
Mori, Y., Kuroda, M., Makino, N. (2016). Multiple Correspondence Analysis. In: Nonlinear Principal Component Analysis and Its Applications. SpringerBriefs in Statistics(). Springer, Singapore. https://doi.org/10.1007/978-981-10-0159-8_3
Liu, J., Huang, Z., Dai, W., Cheng, C., Wu, J., Sha, J., ... & Chen, E. (2025). CogMath: Assessing LLMs' Authentic Mathematical Ability from a Human Cognitive Perspective. arXiv preprint arXiv:2506.04481.
Wang, R., Wang, R., Shen, Y., Wu, C., Zhou, Q., & Chandra, R. (2025). Evaluation of LLMs for mathematical problem solving. arXiv preprint arXiv:2506.00309.
Perez, M. A. P., Orozco, B. L., Soto, J. T. C., Hernandez, M. B., Gonzalez, M. A. A., & Malagon, S. (2025). AI4Math: A Native Spanish Benchmark for University-Level Mathematical Reasoning in Large Language Models. arXiv preprint arXiv:2505.18978.
Supplementary material tables
Discuss
