
Today, I’m happy to announce Amazon EC2 Capacity Manager, a centralized solution to monitor, analyze, and manage capacity usage across all accounts and AWS Regions from a single interface. This service aggregates capacity information with hourly refresh rates and provides prioritized optimization opportunities, streamlining capacity management workflows that previously required custom automation or manual data collection from multiple AWS services.
Organizations using Amazon Elastic Compute Cloud (Amazon EC2) at scale operate hundreds of instance types across multiple Availability Zones and accounts, using On-Demand Instances, Spot Instances, and Capacity Reservations. This complexity means customers currently access capacity data through various AWS services including the AWS Management Console, Cost and Usage Reports, Amazon CloudWatch, and EC2 describe APIs. This distributed approach can create operational overhead through manual data collection, context switching between tools, and the need for custom automation to aggregate information for capacity optimization analysis.
EC2 Capacity Manager helps you overcome these operational complexities by consolidating all capacity data into a unified dashboard. You can now view cross-account and cross-Region capacity metrics for On-Demand Instances, Spot Instances, and Capacity Reservations across all commercial AWS Regions from a single location, eliminating the need to build custom data collection tools or navigate between multiple AWS services.
This consolidated visibility can help you discover cost savings by highlighting underutilized Capacity Reservations, analyzing usage patterns across instance types, and providing insights into Spot Instance interruption patterns. By having access to comprehensive capacity data in one place, you can make more informed decisions about rightsizing your infrastructure and optimizing your EC2 spending.
Let me show you the capabilities of EC2 Capacity Manager in detail.
Getting started with EC2 Capacity Manager
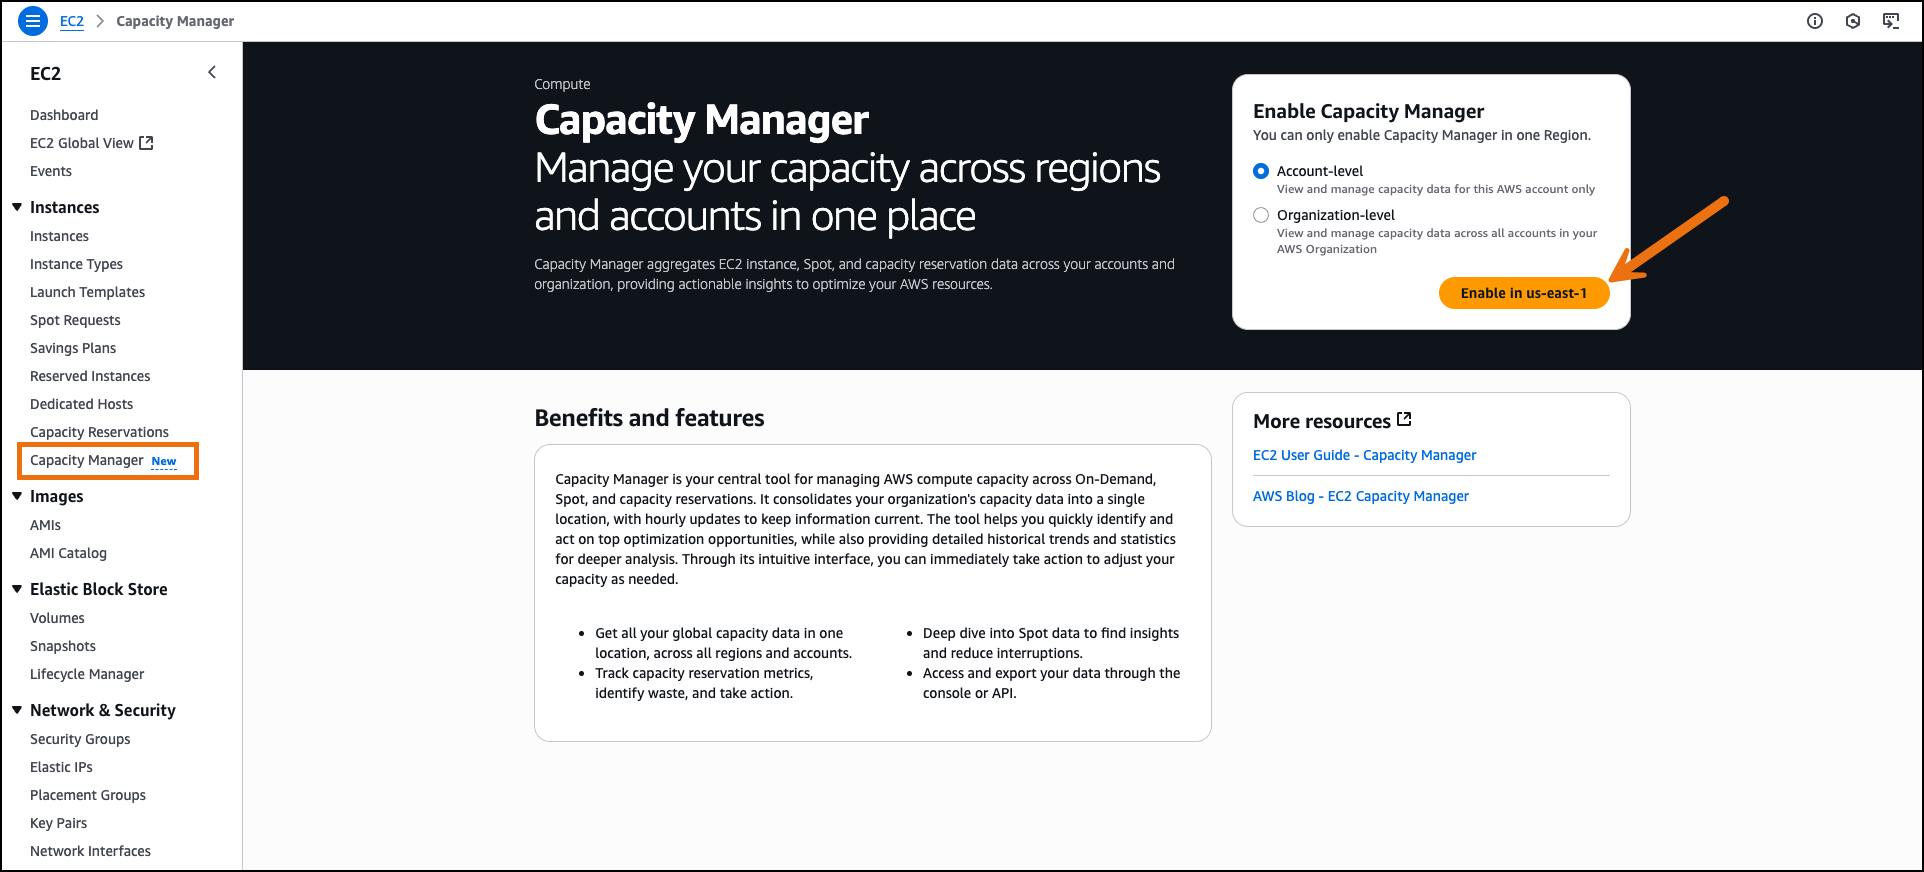
On the AWS Management Console, I navigate to Amazon EC2 and select Capacity Manager from the navigation pane. I enable EC2 Capacity Manager through the service settings. The service aggregates historical data from the previous 14 days during initial setup.
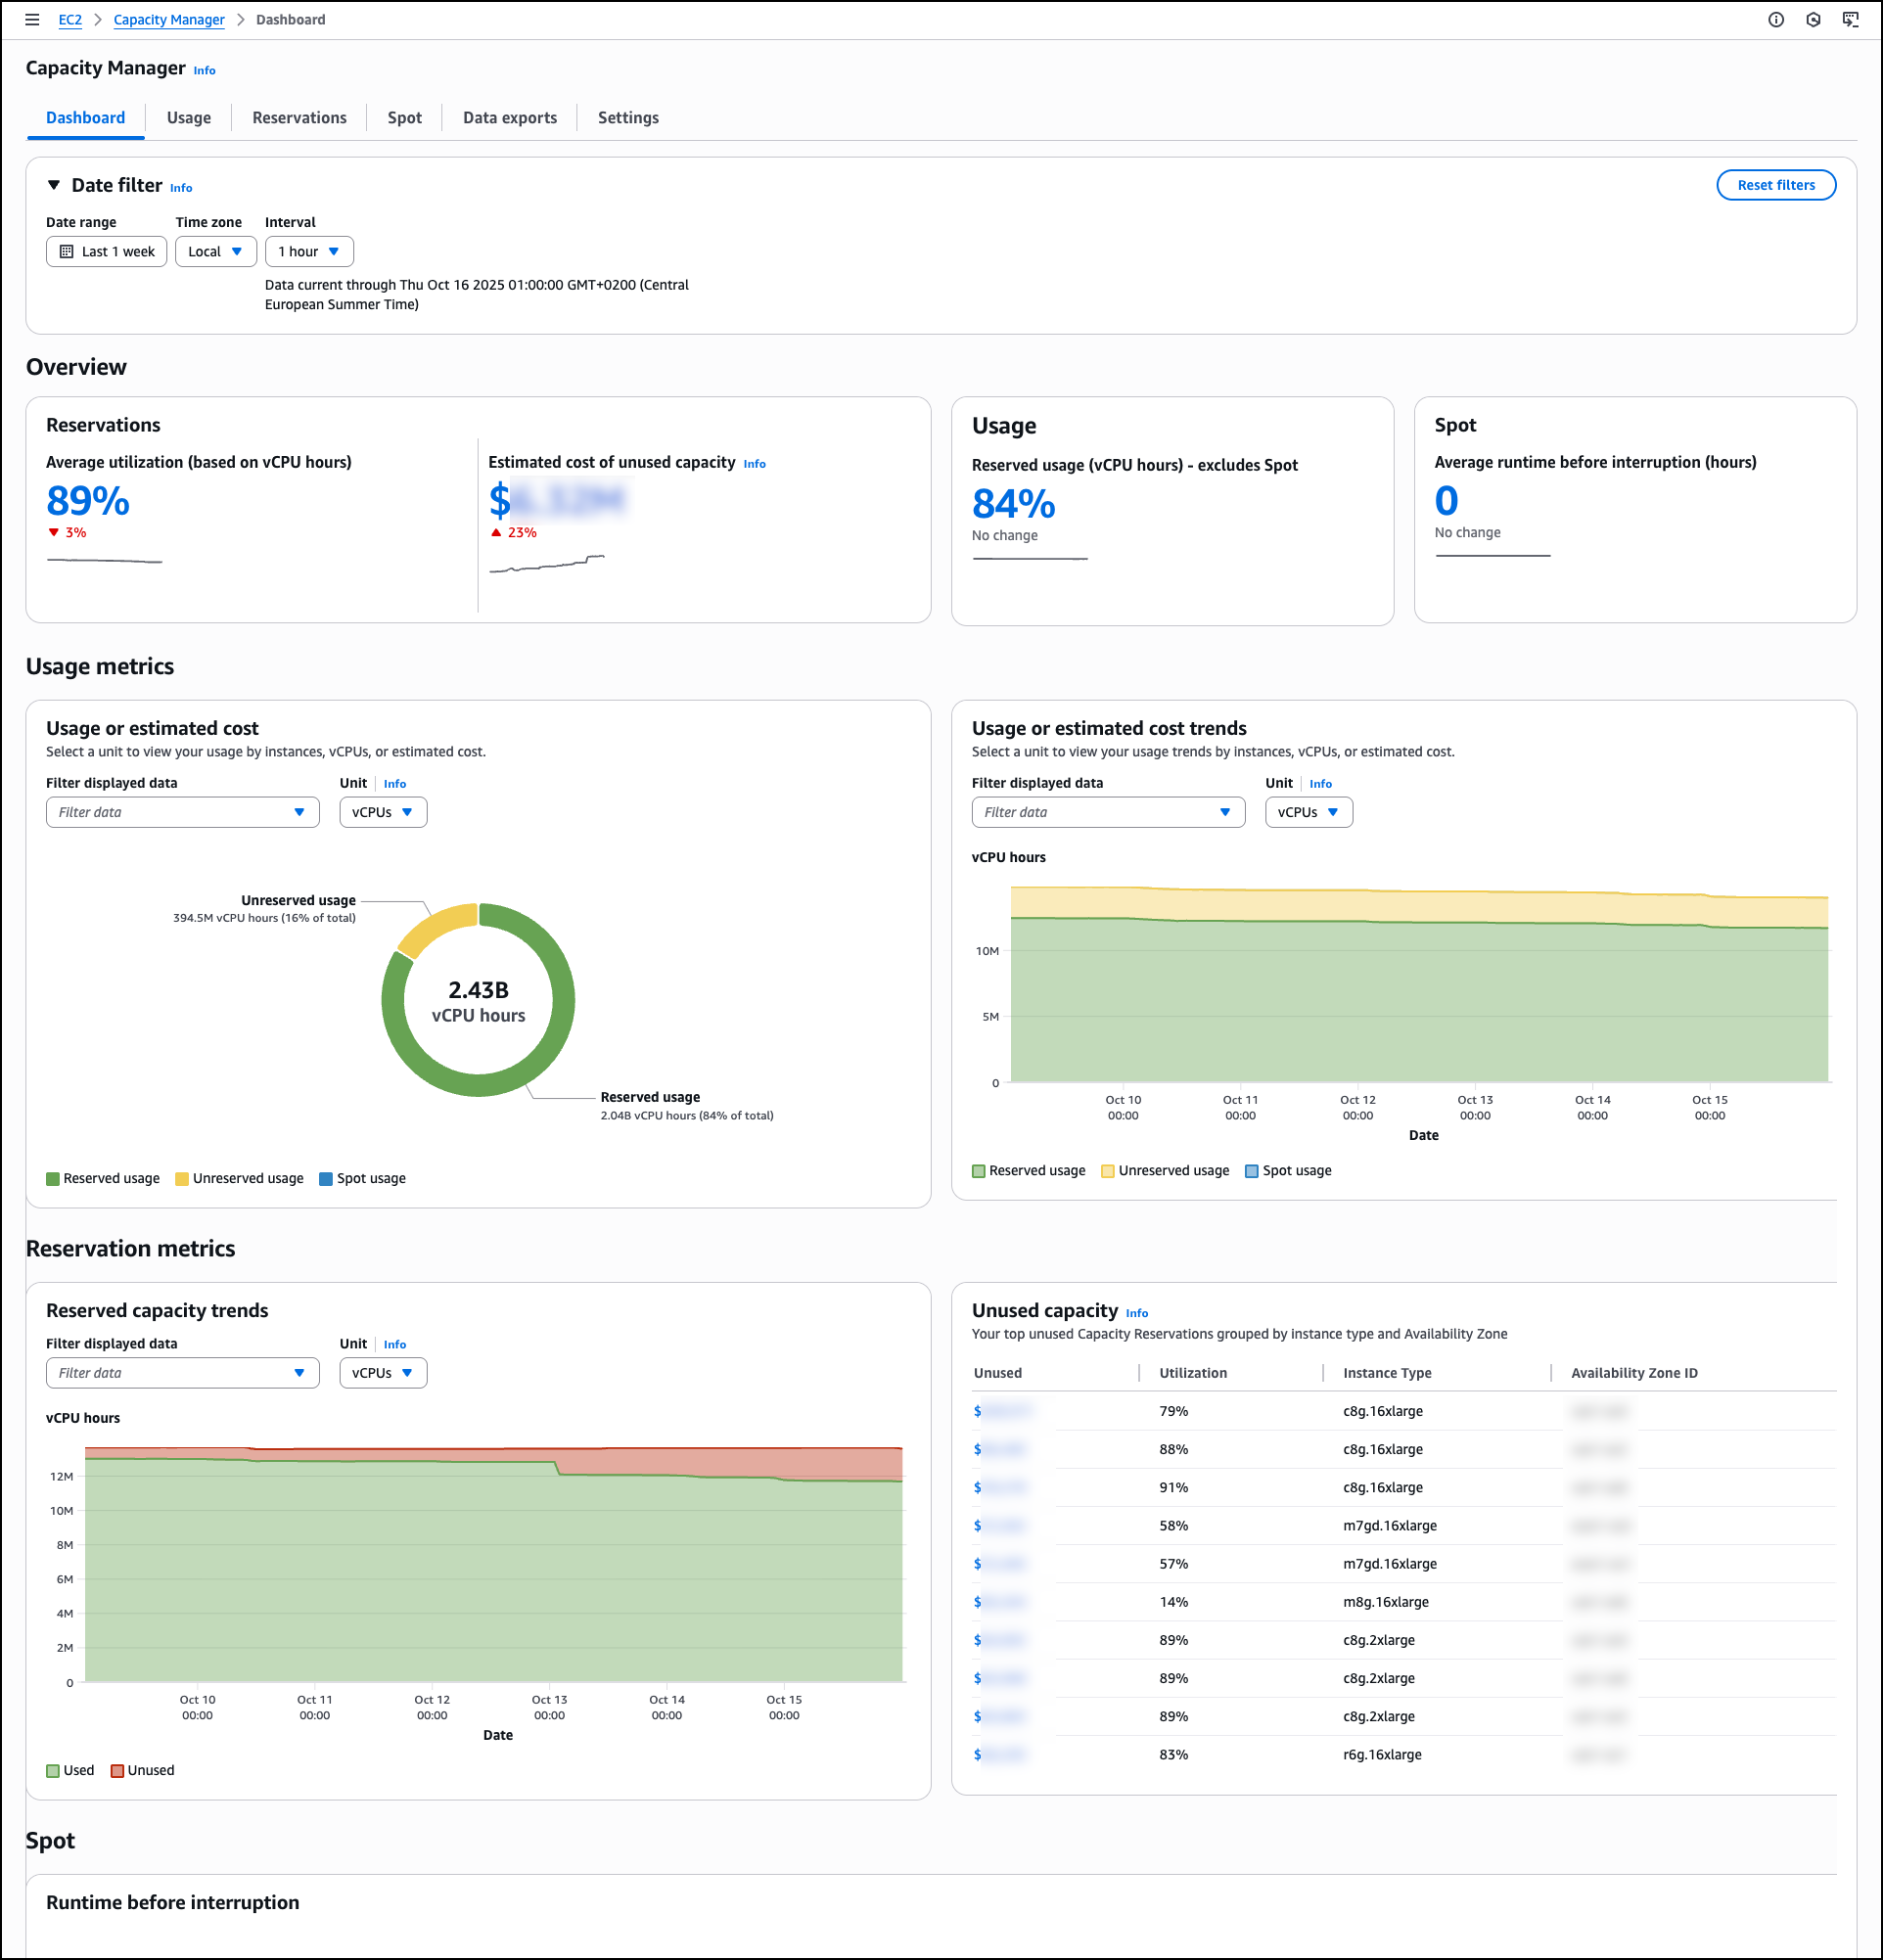
The main Dashboard displays capacity utilization across all instance types through a comprehensive overview section that presents key metrics at a glance. The capacity overview cards for Reservations, Usage, and Spot show trend indicators and percentage changes to help you identify capacity patterns quickly. You can apply filtering through the date filter controls, which include date range selection, time zone configuration, and interval settings.
You can select different units to analyze data by vCPUs, instance counts, or estimated costs to understand resource consumption patterns. Estimated costs are based on published On-Demand rates and do not include Savings Plans or other discounts. This pricing reference helps you compare the relative impact of underutilized capacity across different instance types—for example, 100 vCPU hours of unused p5 reservations represents a larger cost impact than 100 vCPU hours of unused t3 reservations.
The dashboard includes detailed Usage metrics with both total usage visualization and usage over time charts. The total usage section shows the breakdown between reserved usage, unreserved usage, and Spot usage. The usage over time chart provides visualization that tracks capacity trends over time, helping you identify usage patterns and peak demand periods.
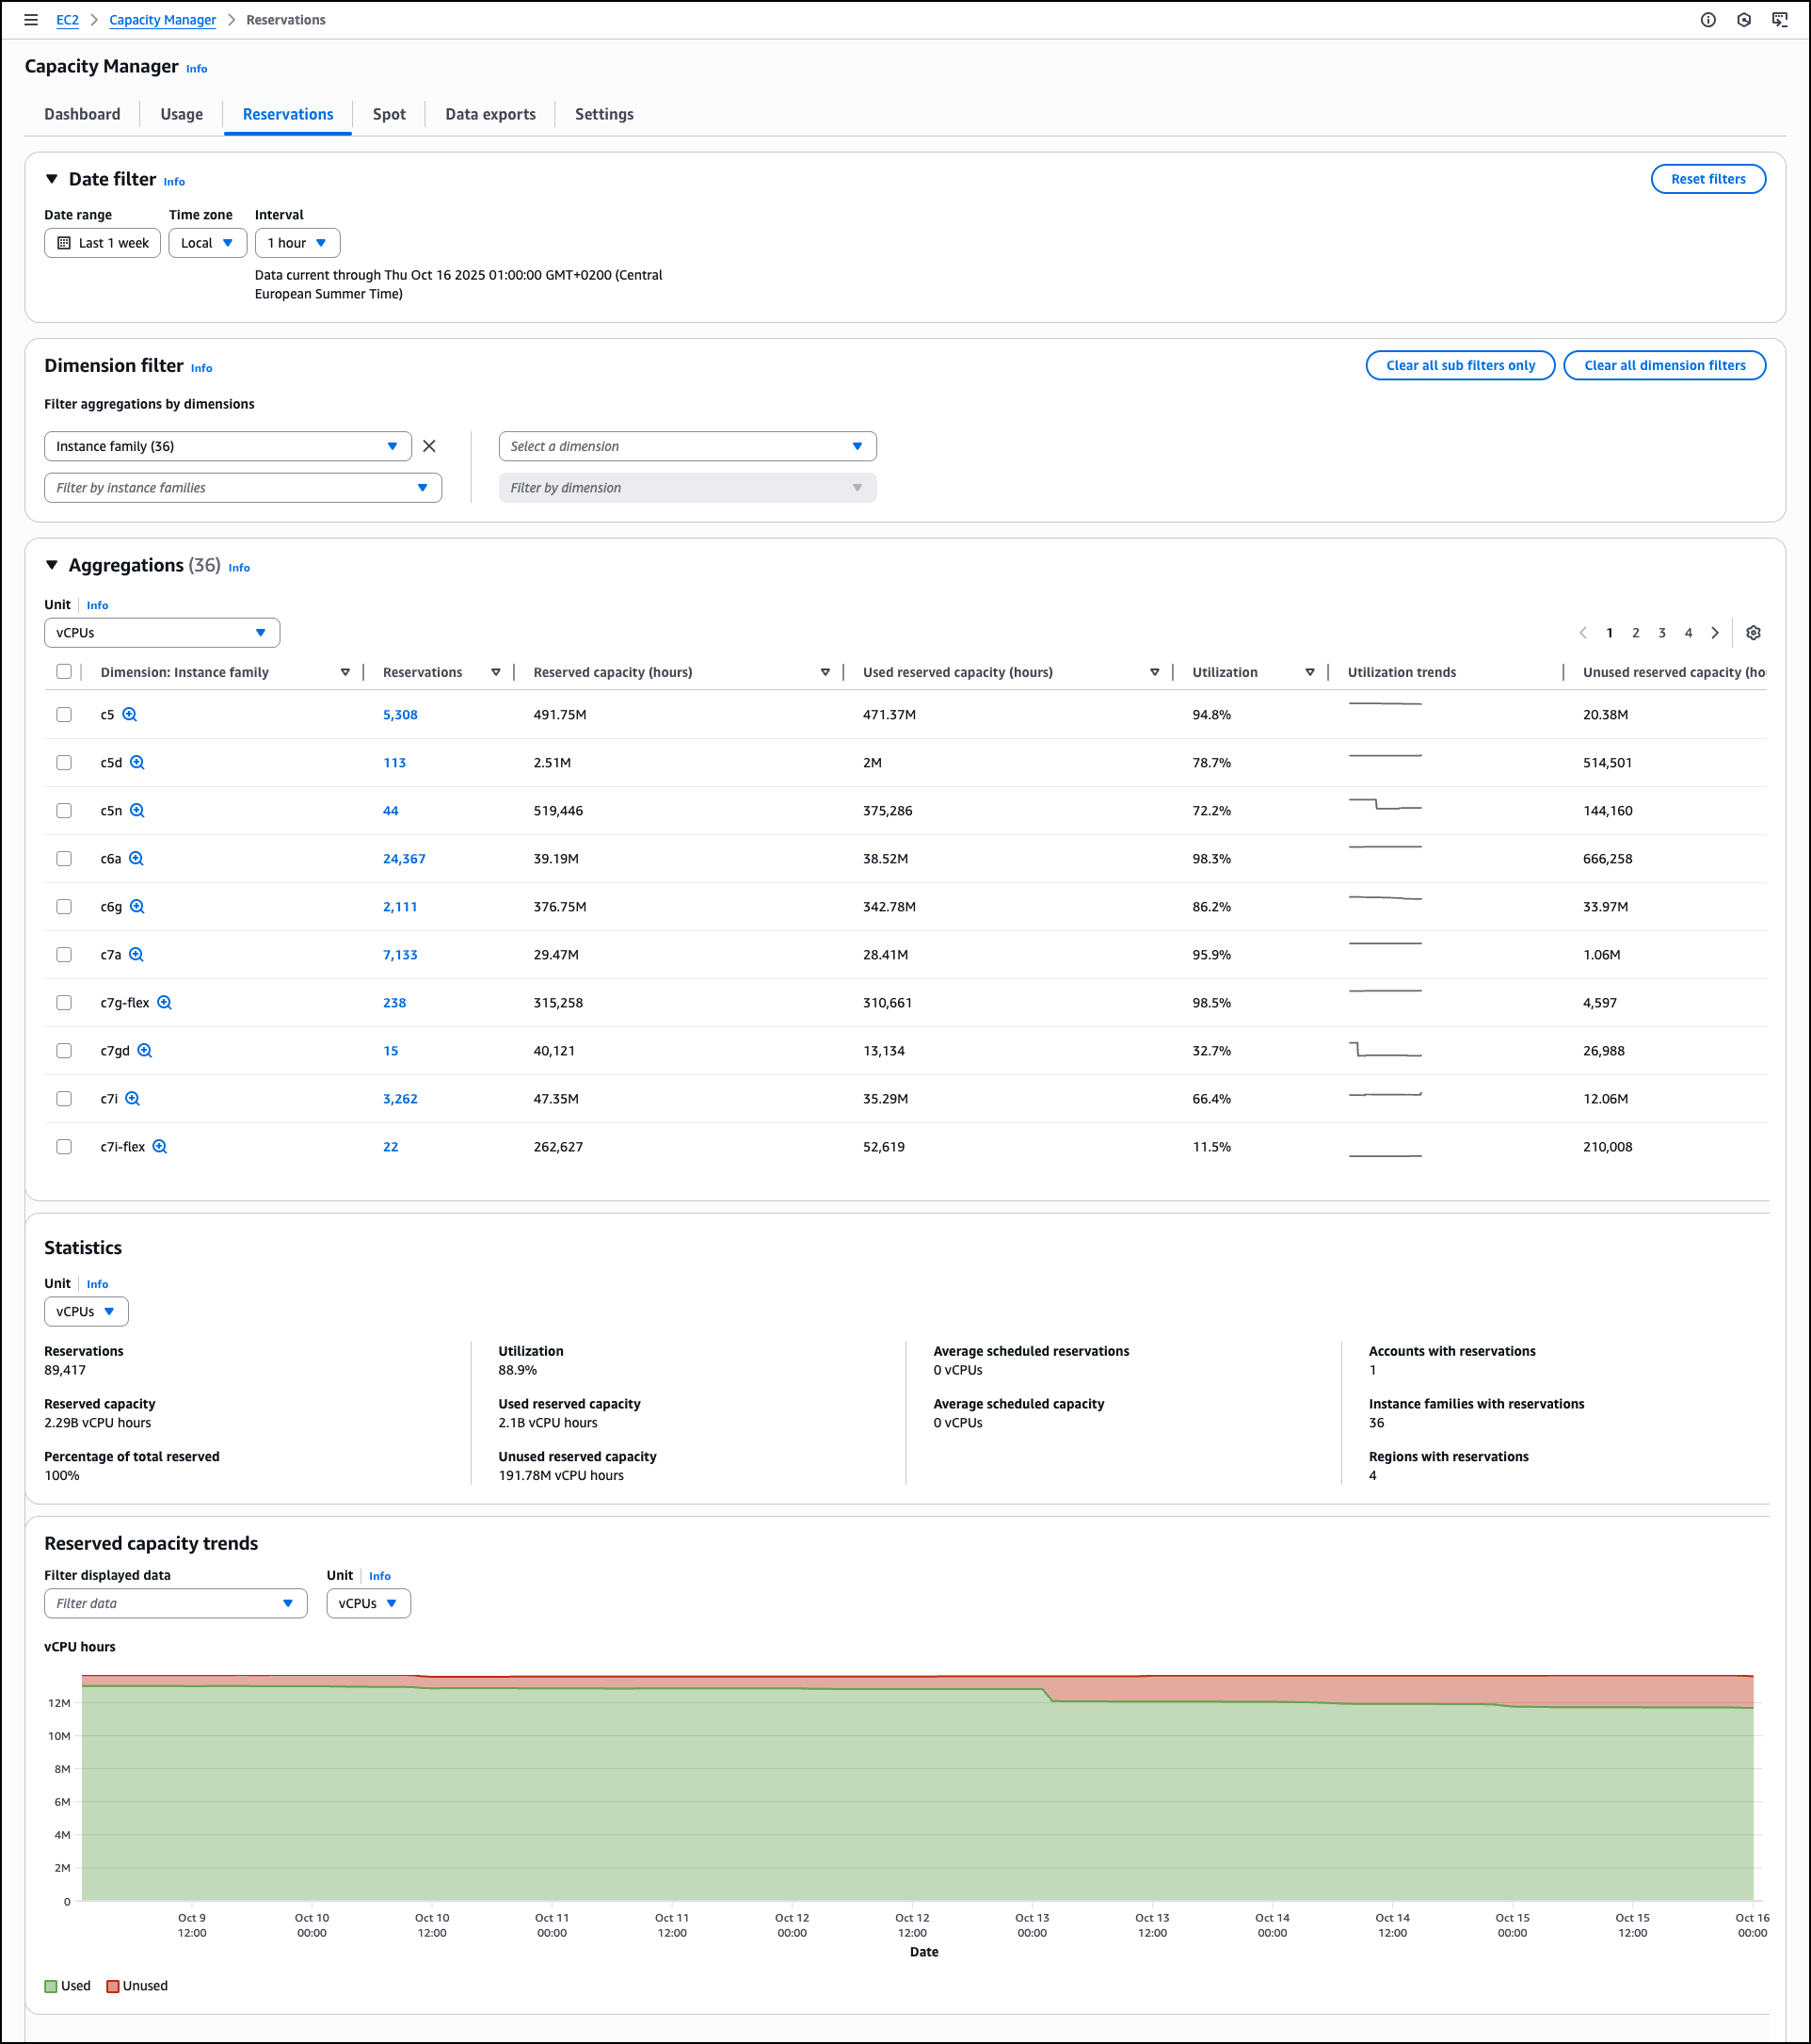
Under Reservation metrics, Reserved capacity trends visualizes used and unused reserved capacity across the selected period, showing the proportion of reserved vCPU hours that remain unutilized compared with those actively consumed, helping you track reservation efficiency patterns and identify periods of consistent low utilization. This visibility can help you reduce costs by identifying underutilized reservations and helping you to make informed decisions about capacity adjustments.
The Unused capacity section lists underutilized capacity reservations by instance type and Availability Zone combinations, displaying specific utilization percentages and instance types across different Availability Zones. This prioritized list helps you identify potential savings with direct visibility into unused capacity costs.
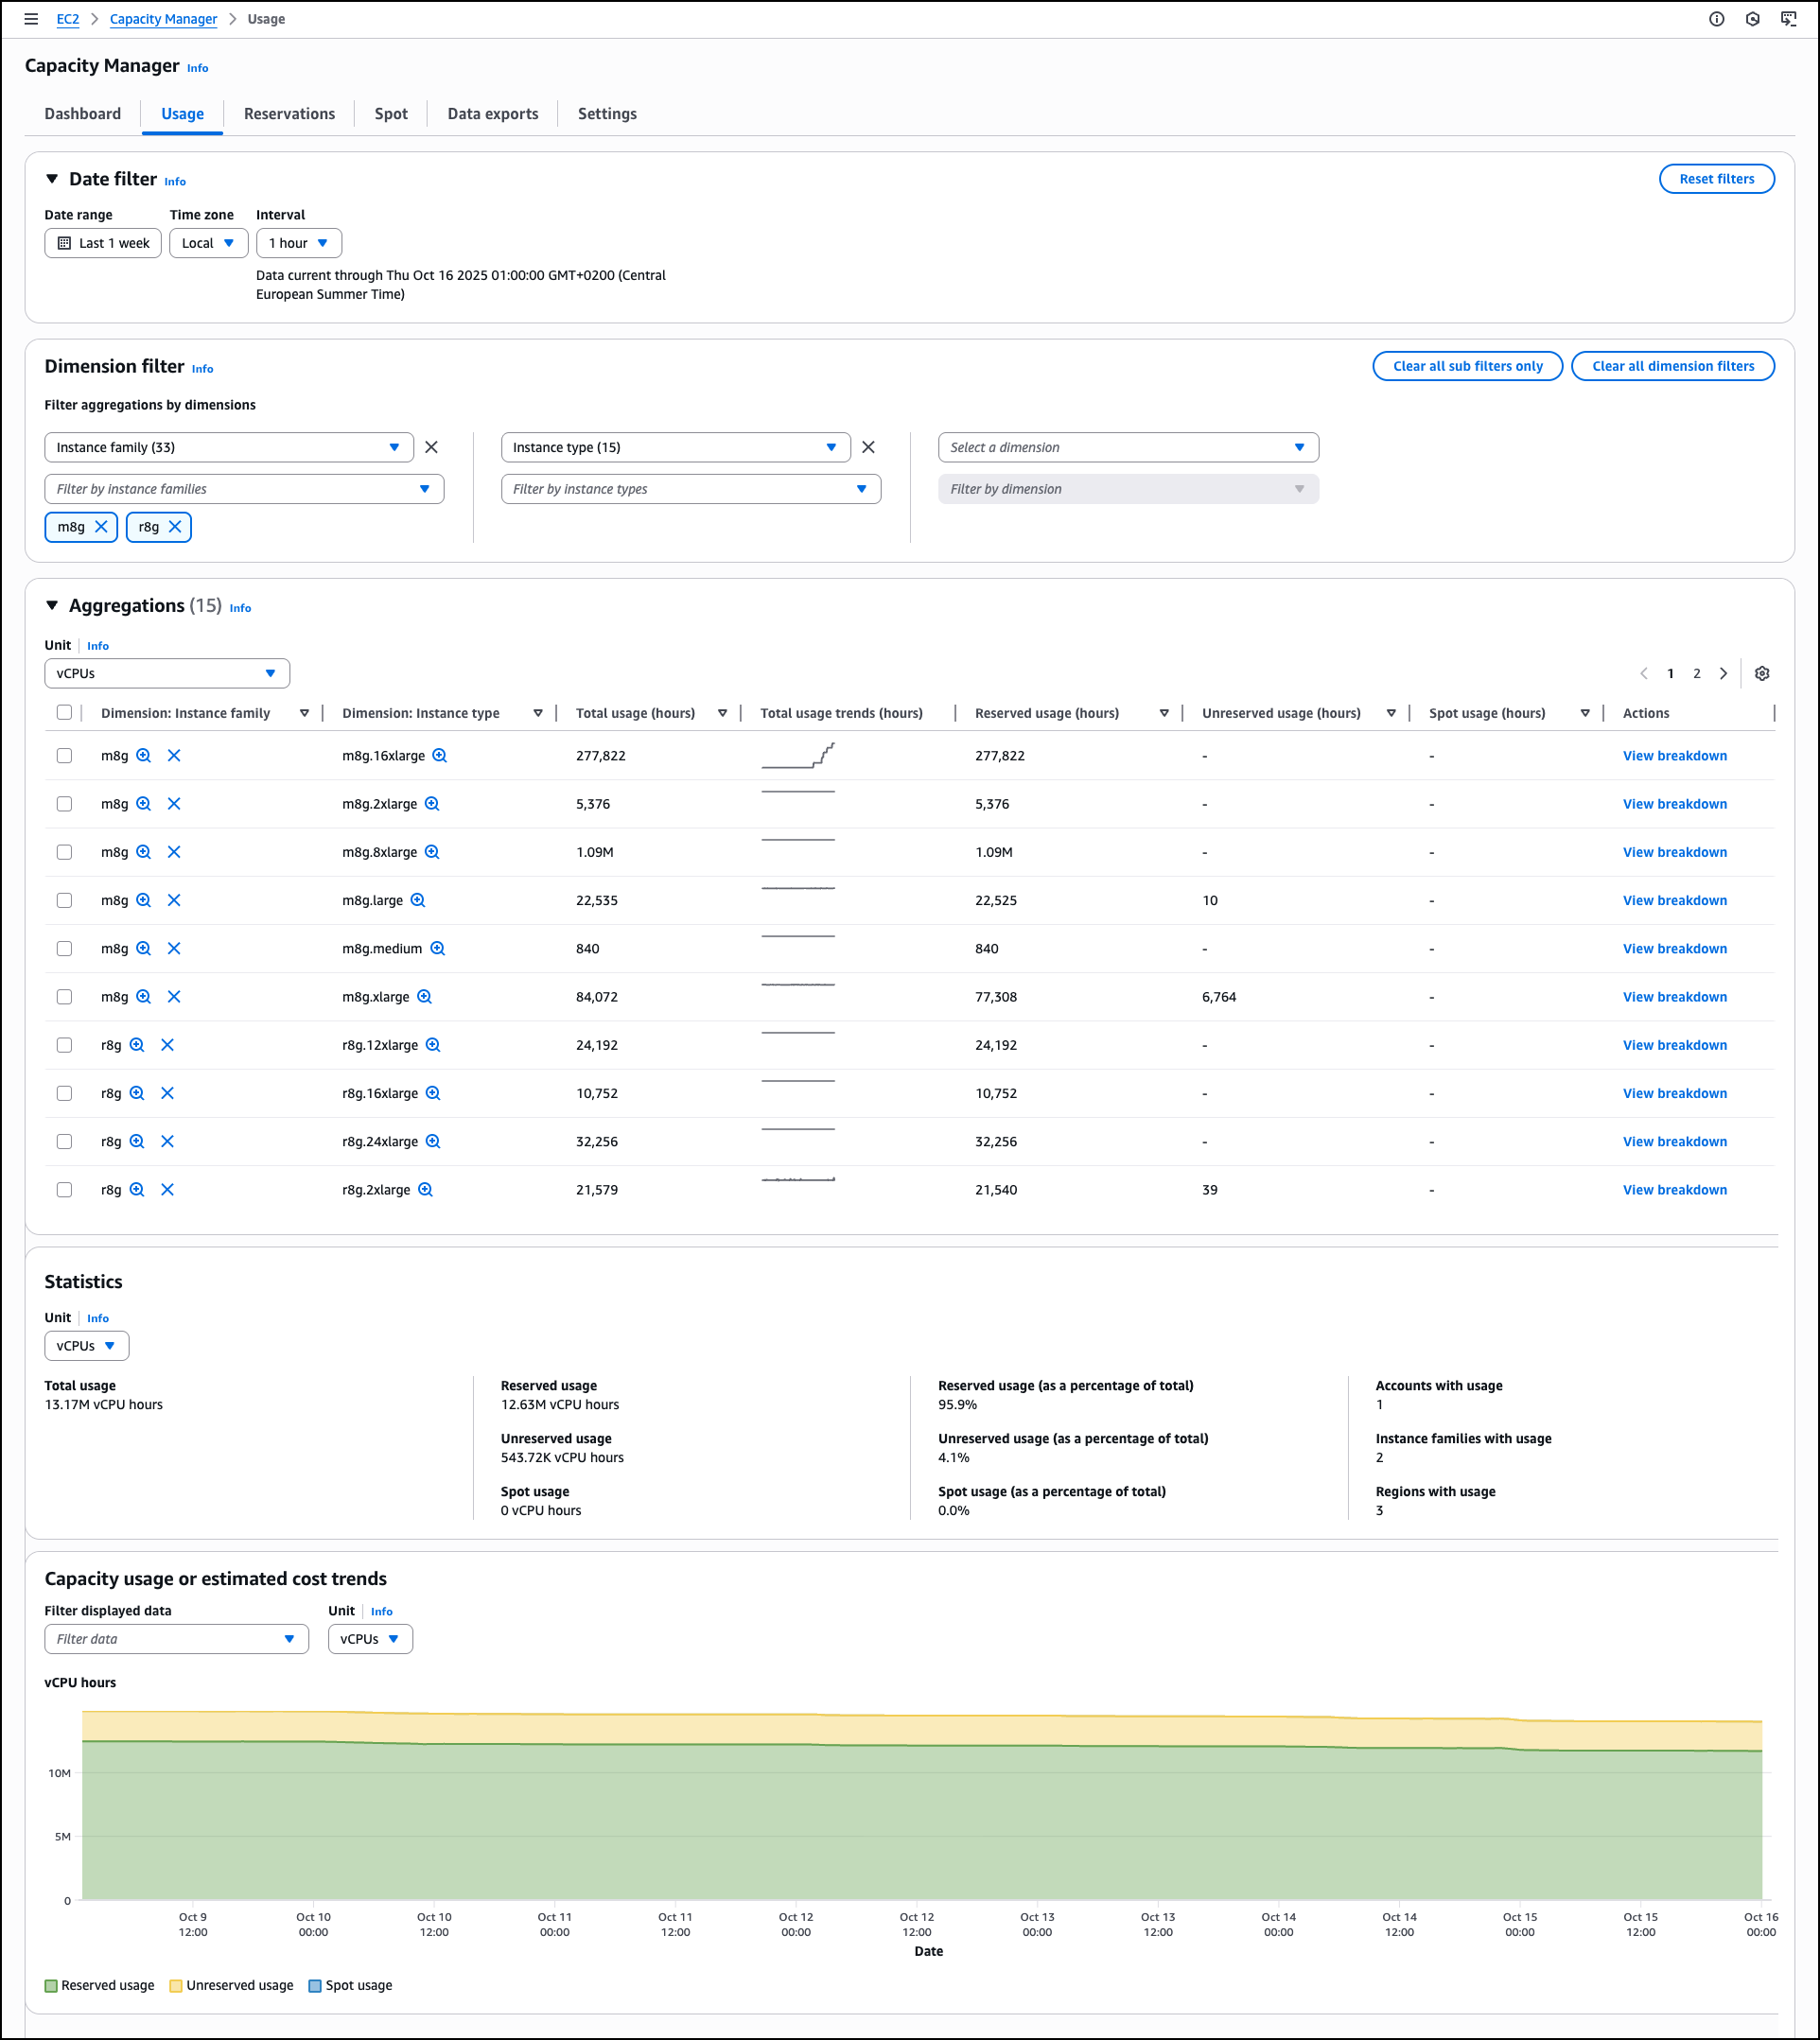
The Usage tab provides detailed historical trends and usage statistics across all AWS Regions for Spot Instances, On-Demand Instances, Capacity Reservations, Reserved Instances, and Savings Plans. Dedicated Hosts usage is not included. The Dimension filter helps you group by and filter capacity data by Account ID, Region, Instance Family, Availability Zone, and Instance Type, creating custom views that reveal usage patterns across your accounts and AWS Organizations. This helps you analyze specific configurations and compare performance across accounts or Regions.
The Aggregations section provides a comprehensive usage table across EC2 and Spot Instances. You can select different units to analyze data by vCPUs, instance counts, or estimated costs to understand resource consumption patterns. The table shows instance family breakdowns with total usage statistics, reserved usage hours, unreserved usage hours, and Spot usage data. Each row includes a View breakdown action for a detailed analysis.
The Capacity usage or estimated cost trends section visualizes usage trends, reserved usage, unreserved usage, and Spot usage. You can filter the displayed data and adjust the unit of measurement to view historical patterns. These filtering and analysis tools help you identify usage trends, compare costs across dimensions, and make informed decisions for capacity planning and optimization.
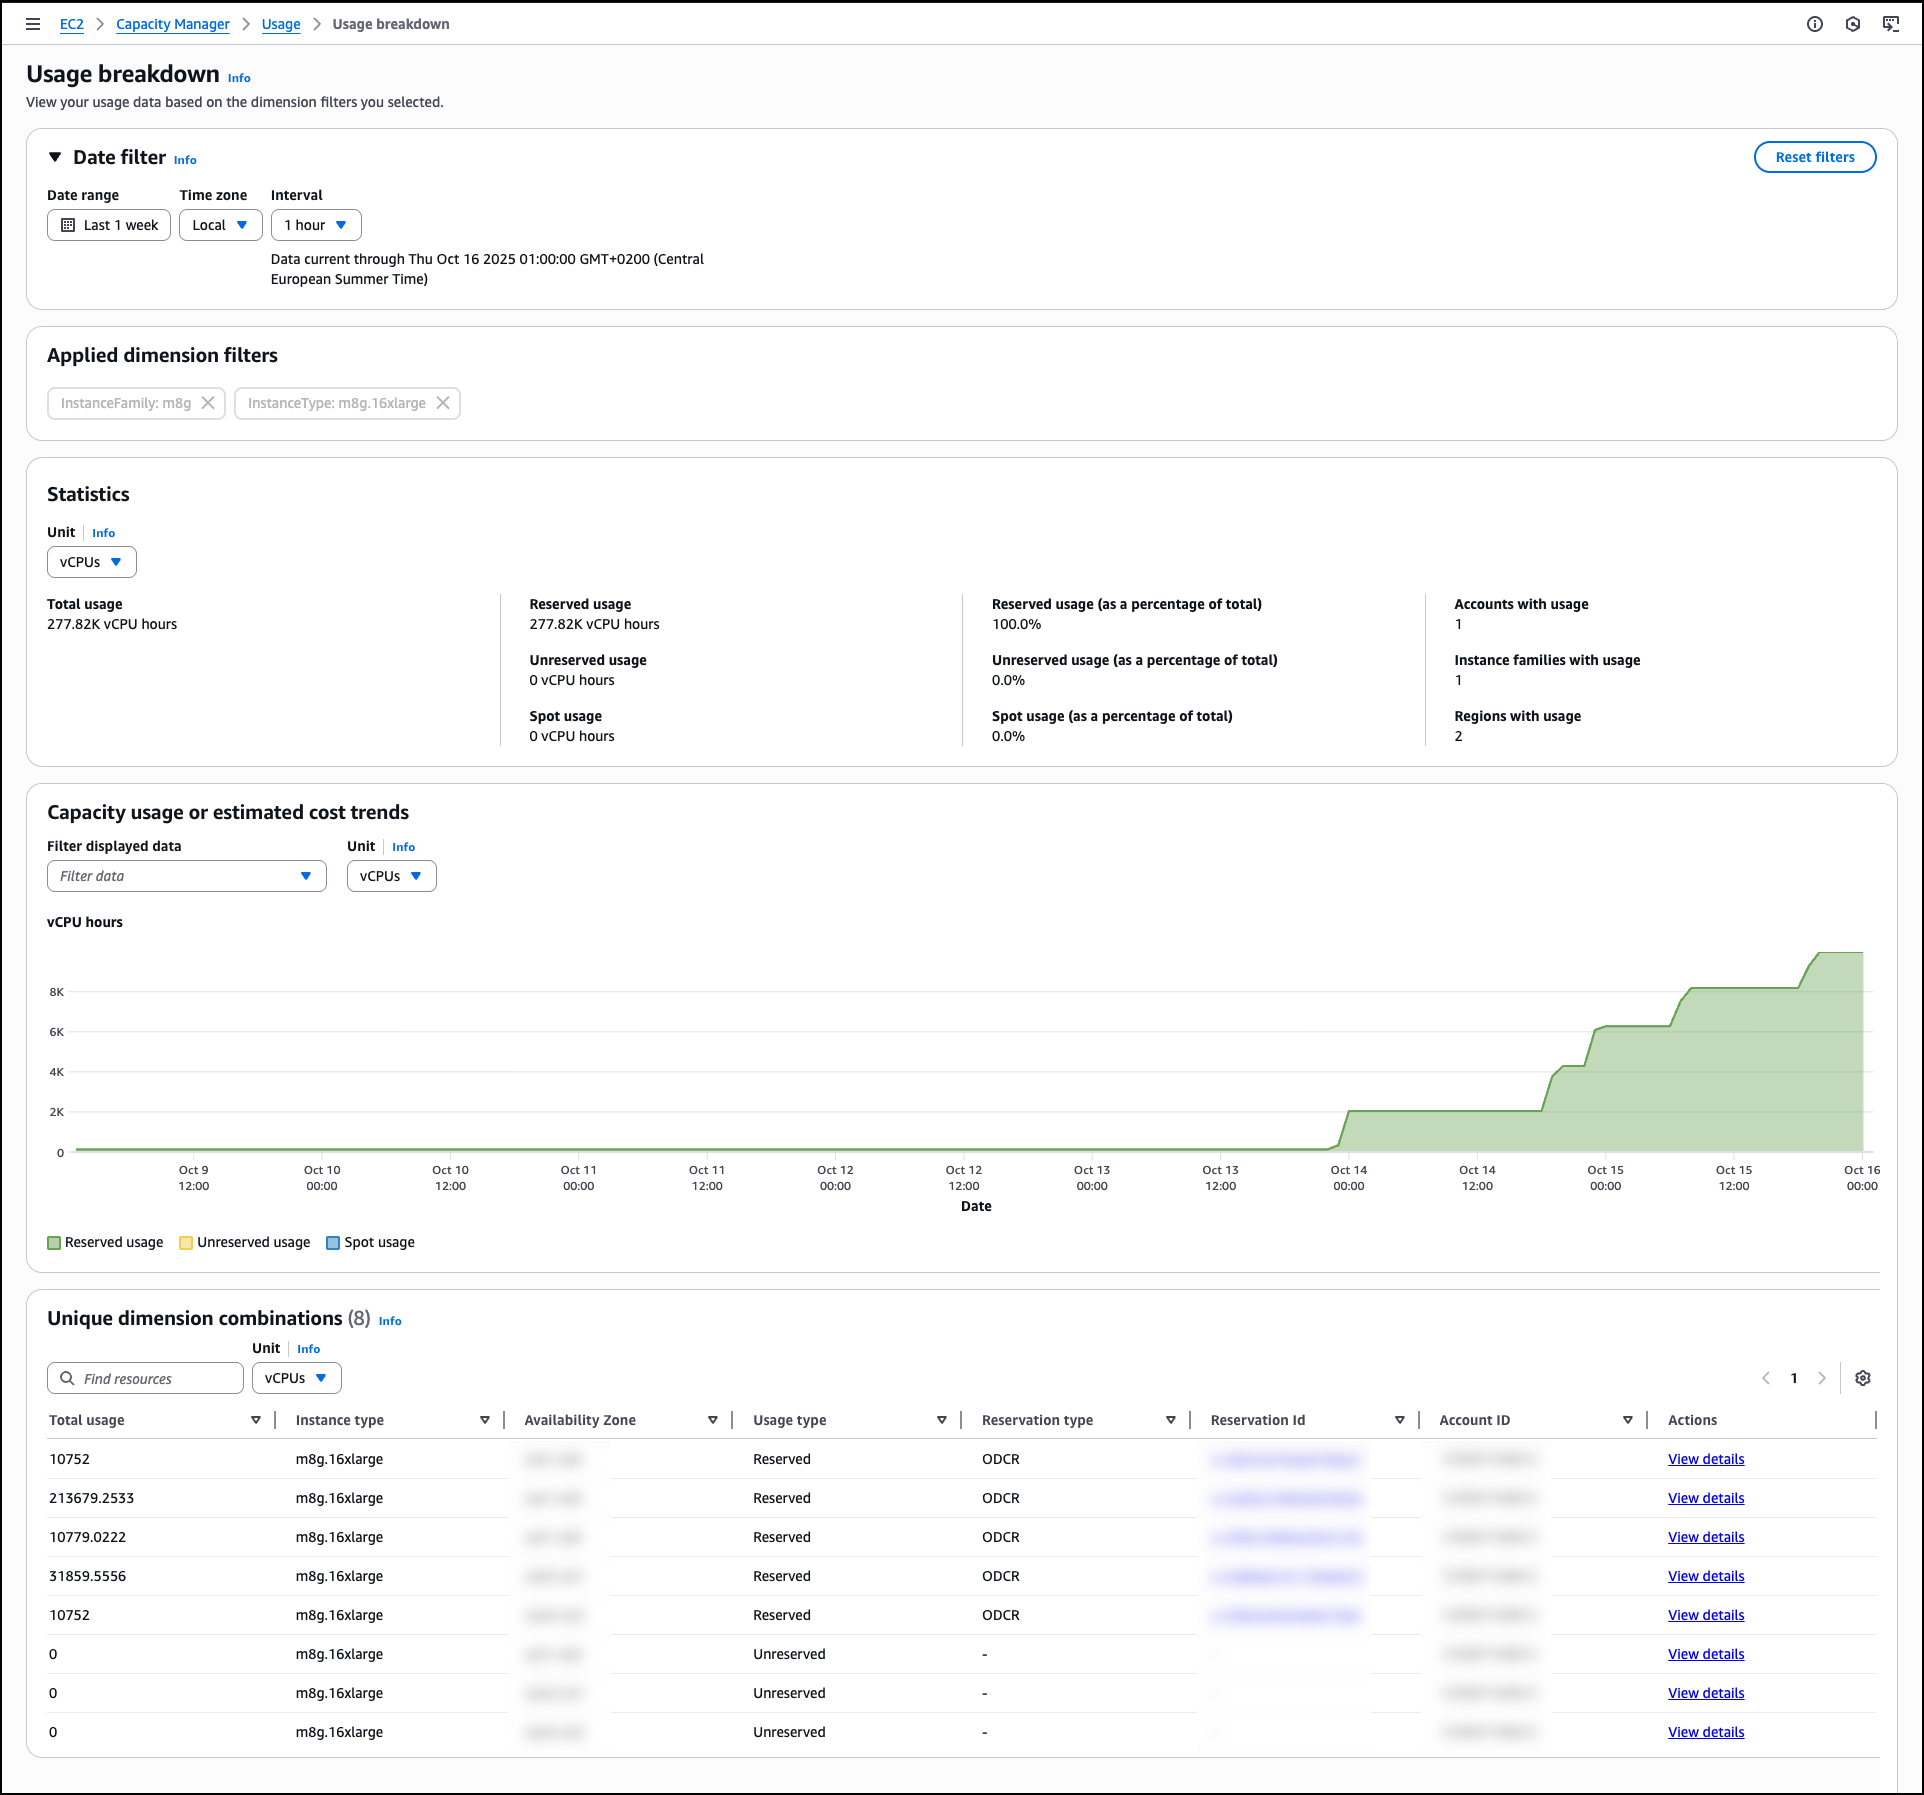
When you choose View breakdown from the Aggregations table, you access detailed Usage breakdown based on the dimension filters you selected. This breakdown view shows usage patterns for individual instance types within the selected family and Availability Zone combinations, helping you identify specific optimization opportunities.
The Reservations tab displays capacity reservation utilization with automated analysis capabilities that generate prioritized lists of optimization opportunities. Similar to the Usage tab, you can apply dimension filters by Account ID, Region, Instance Family, Availability Zone, and Instance Type along with additional options related to the reservation details. On each of the tabs you can drill down to see data for individual line items. For reservations specifically, you can view specific reservations and access detailed information about On-Demand Capacity Reservations (ODCRs), including utilization history, configuration parameters, and current status. When the ODCR exists in the same account as Capacity Manager, you can modify reservation parameters directly from this interface, eliminating the need to navigate to separate EC2 console sections for reservation management.
The Statistics section provides summary metrics, including total reservations count, overall utilization percentage, reserved capacity totals, used and unused capacity volumes, average scheduled reservations, and counts of accounts, instance families, and Regions with reservations.
This consolidated view helps you understand reservation distribution and utilization patterns across your infrastructure. For example, you might discover that your development accounts consistently show 30% reservation utilization while production accounts exceed 95%, indicating an opportunity to redistribute or modify reservations. Similarly, you could identify that specific instance families in certain Regions have sustained low utilization rates, suggesting candidates for reservation adjustments or workload optimization. These insights help you make data-driven decisions about reservation purchases, modifications, or cancellations to better align your reserved capacity with actual usage patterns.
The Spot tab focuses on Spot Instance usage and displays the amount of time your Spot instances run before being interrupted. This analysis of Spot Instance usage patterns helps you identify optimization opportunities for Spot Instance workloads. You can use Spot placement score recommendations to improve workload flexibility.
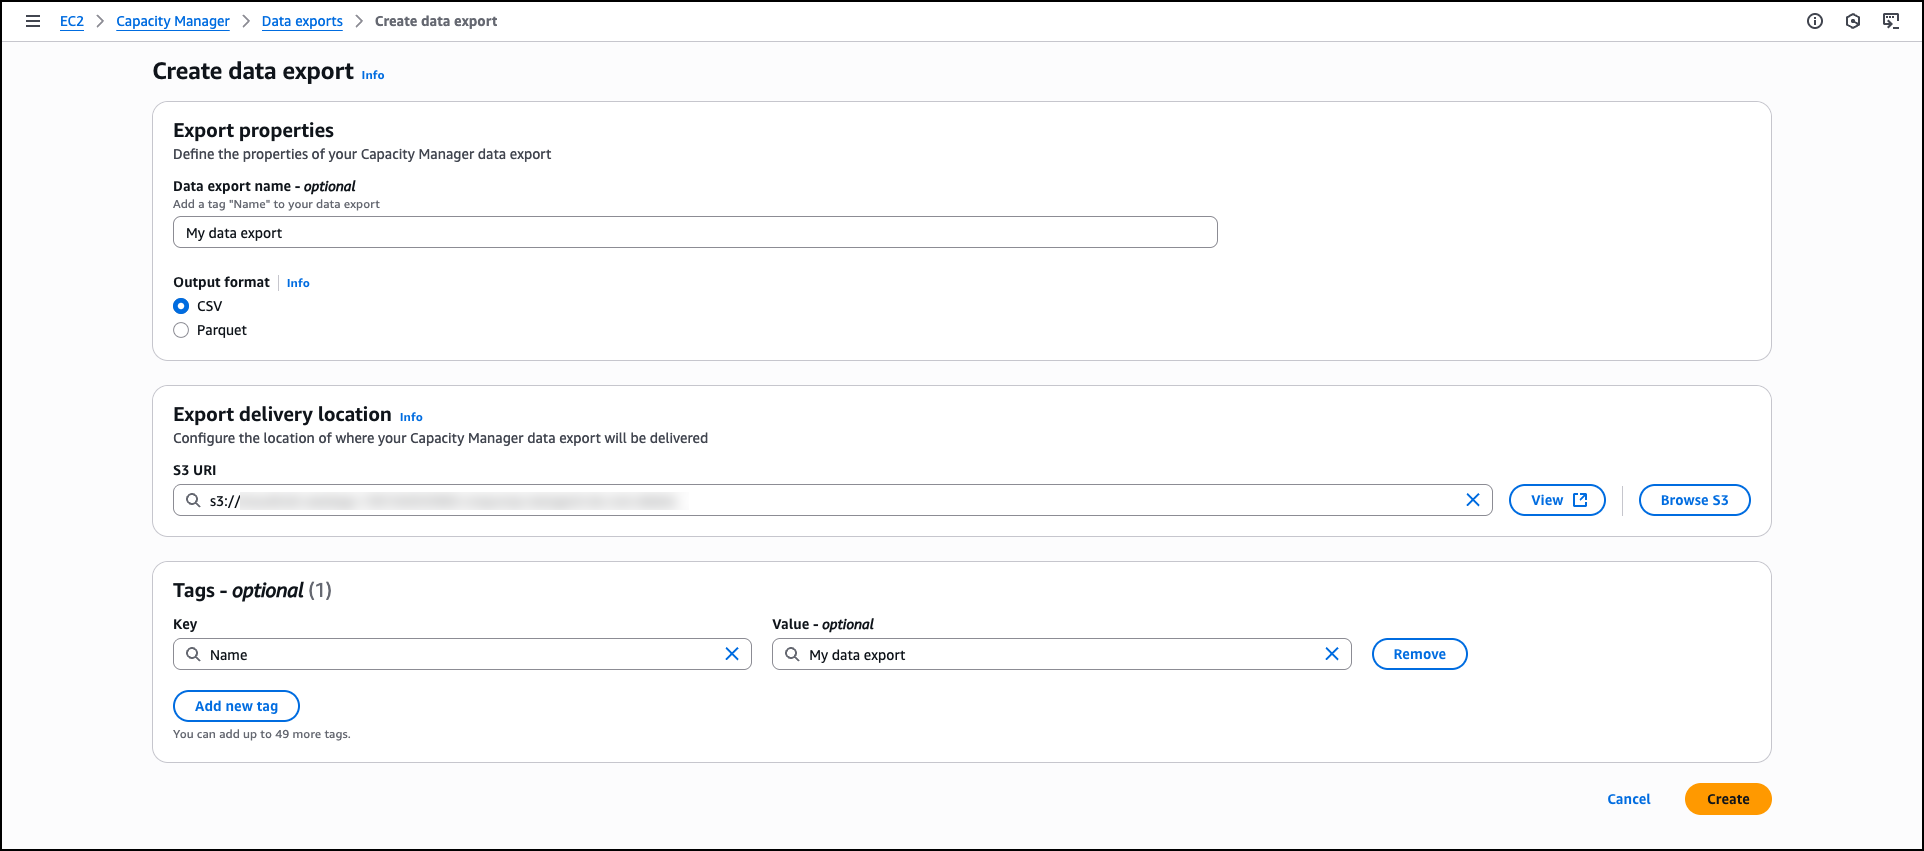
For organizations requiring data export capabilities, Capacity Manager includes data exports to Amazon Simple Storage Service (Amazon S3) buckets for capacity analysis. You can view and manage your data exports through the Data exports tab, which helps you create new exports, monitor delivery status, and configure export schedules to analyze capacity data outside the AWS Management Console.
Data exports extend your analytical capabilities by storing capacity data beyond the 90-day retention period available through the console and APIs. This extended retention enables long-term trend analysis and historical capacity planning. You can also integrate exported data with existing analytics workflows, business intelligence tools, or custom reporting systems to incorporate EC2 capacity metrics into broader infrastructure analysis and decision-making processes.
The Settings section provides configuration options for AWS Organizations integration, enabling centralized capacity management across multiple accounts. Organization administrators can enable enterprise-wide capacity visibility or delegate access to specific accounts while maintaining appropriate permissions and access controls.
Now available
EC2 Capacity Manager eliminates the operational overhead of collecting and analyzing capacity data from multiple sources. The service provides automated optimization opportunities, centralized multi-account visibility, and direct access to capacity management tools. You can reduce manual analysis time while improving capacity utilization and cost optimization across your EC2 infrastructure.
Amazon EC2 Capacity Manager is available at no additional cost. To begin using Amazon EC2 Capacity Manager, visit the Amazon EC2 console or access the service APIs. The service is available in all commercial AWS Regions.
To learn more, visit the EC2 Capacity Manager documentation.
— Esra