
This cookbook provides a practical guide on how to use the OpenAI Platform to easily build resilience into your prompts.
A resilient prompt is one that provides high-quality responses across the full breadth of possible inputs.
Prompt resilience is an essential piece of deploying AI applications in production. Without this property, your prompts can produce unexpected results on edge cases, provide subpar responses in normal cases, and undermine the effectiveness of your AI application.
To build resilience into your prompts, we recommend the evaluation flywheel process — a methodology that enables builders to continuously refine their AI applications over time in a measurable way.
This cookbook is designed for subject-matter experts, solutions architects, data scientists, and AI engineers who are looking to improve the general consistency and quality of their prompts, or address specific edge cases in their AI applications.
AI applications often feel brittle. A prompt that works well one day can produce unexpected and low-quality results the next. This happens because prompts can be sensitive to small changes in user input or context. To build reliable AI products, we need a systematic way to make prompts more resilient.
The solution is a continuous, iterative process called the evaluation flywheel. Instead of guessing what might improve a prompt ("prompt-and-pray"), this lifecycle provides a structured engineering discipline to diagnose, measure, and solve problems.
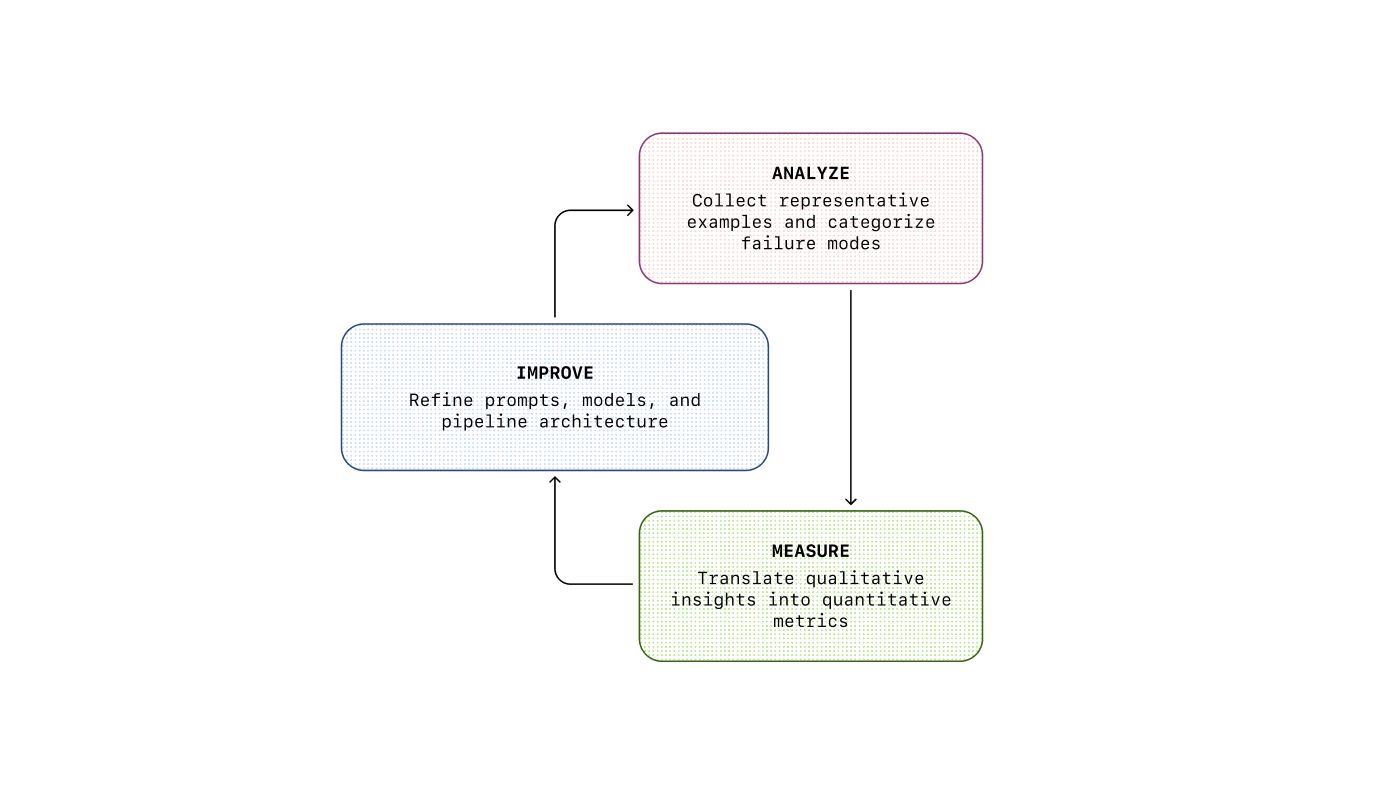
The flywheel consists of three phases:
Analyze:Understand how and why your system is failing through qualitative review. Manually examine and annotate examples where the model behaves incorrectly to identify recurring failure modes.
Measure:Quantify the identified failure modes and set a baseline. You can’t improve what you can’t measure. Create a test dataset and build automated evaluators (“graders”) to score your system’s performance at scale.
Improve:Make targeted improvements such as rewriting prompts, adding better examples, or adjusting system components. With measurement in place, you can immediately see the impact of changes and iterate until failure rates are acceptably low.
This is a continuous cycle. As you improve the system, new, subtler failure modes emerge — and the flywheel begins again. This process is the core methodology for building robust and reliable AI applications.
Source: Shankar, S., & Husain, H. (2025). Application-Centric AI Evals for Engineers and Technical Product Managers. AI Evals Course Reader.
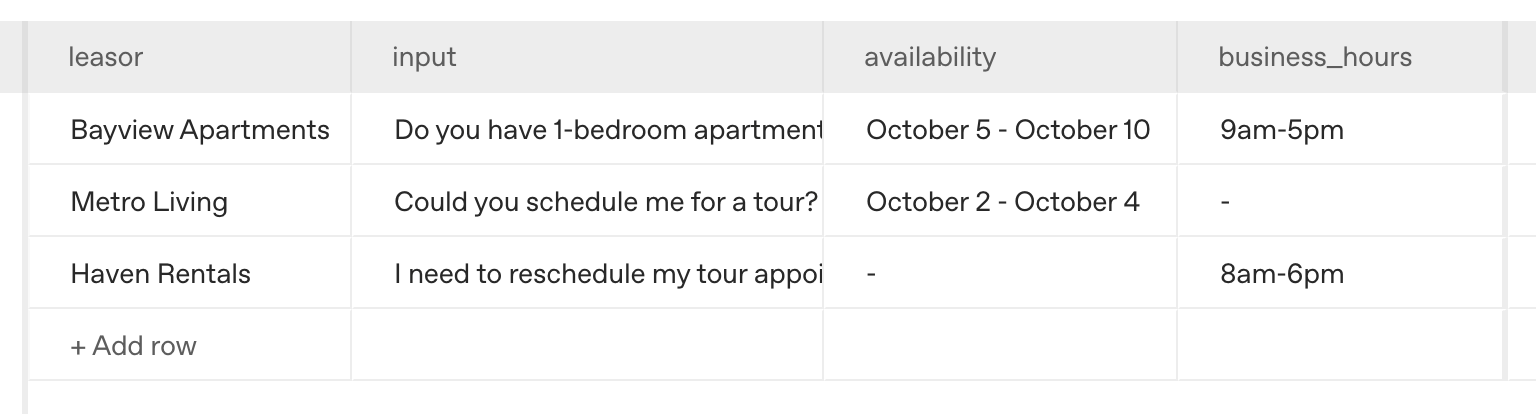
To illustrate the evaluation process, let’s use data from an apartment leasing assistant in production.
It answers questions from prospective renters, such as:
- “How large are the apartments?”“When can I come in for a tour?”
Suppose we have a specific prompt within our application that we’d like to analyze. We can get started in the OpenAI Platform by adding in our prompt and uploading our input and output data to our Dataset (learn more about how to do this in our dhttps://cookbook.openai.com/images/dataset.pngmg src="/images/dataset.png" alt="Leasing agent data">
With our prompt and traces loaded in, we’re ready to analyze prompt effectiveness.
To improve a system, you must first understand how it fails. While automated metrics are useful for tracking progress, they cannot reveal why a failure occurred. Manual analysis of model outputs is the most effective way to diagnose issues and gain insights for targeted improvements.
The core of this analysis is annotation — applying structured labels to text to categorize and understand failure modes. This turns unstructured failures into an actionable roadmap for improvement. We recommend a two-step method drawn from qualitative research: open coding and axial coding.
The first step is to read through a sample of failing traces (we recommend starting with around 50) and apply descriptive labels to each error you find. In this phase, do not worry about creating a perfect, structured taxonomy. The goal is discovery.
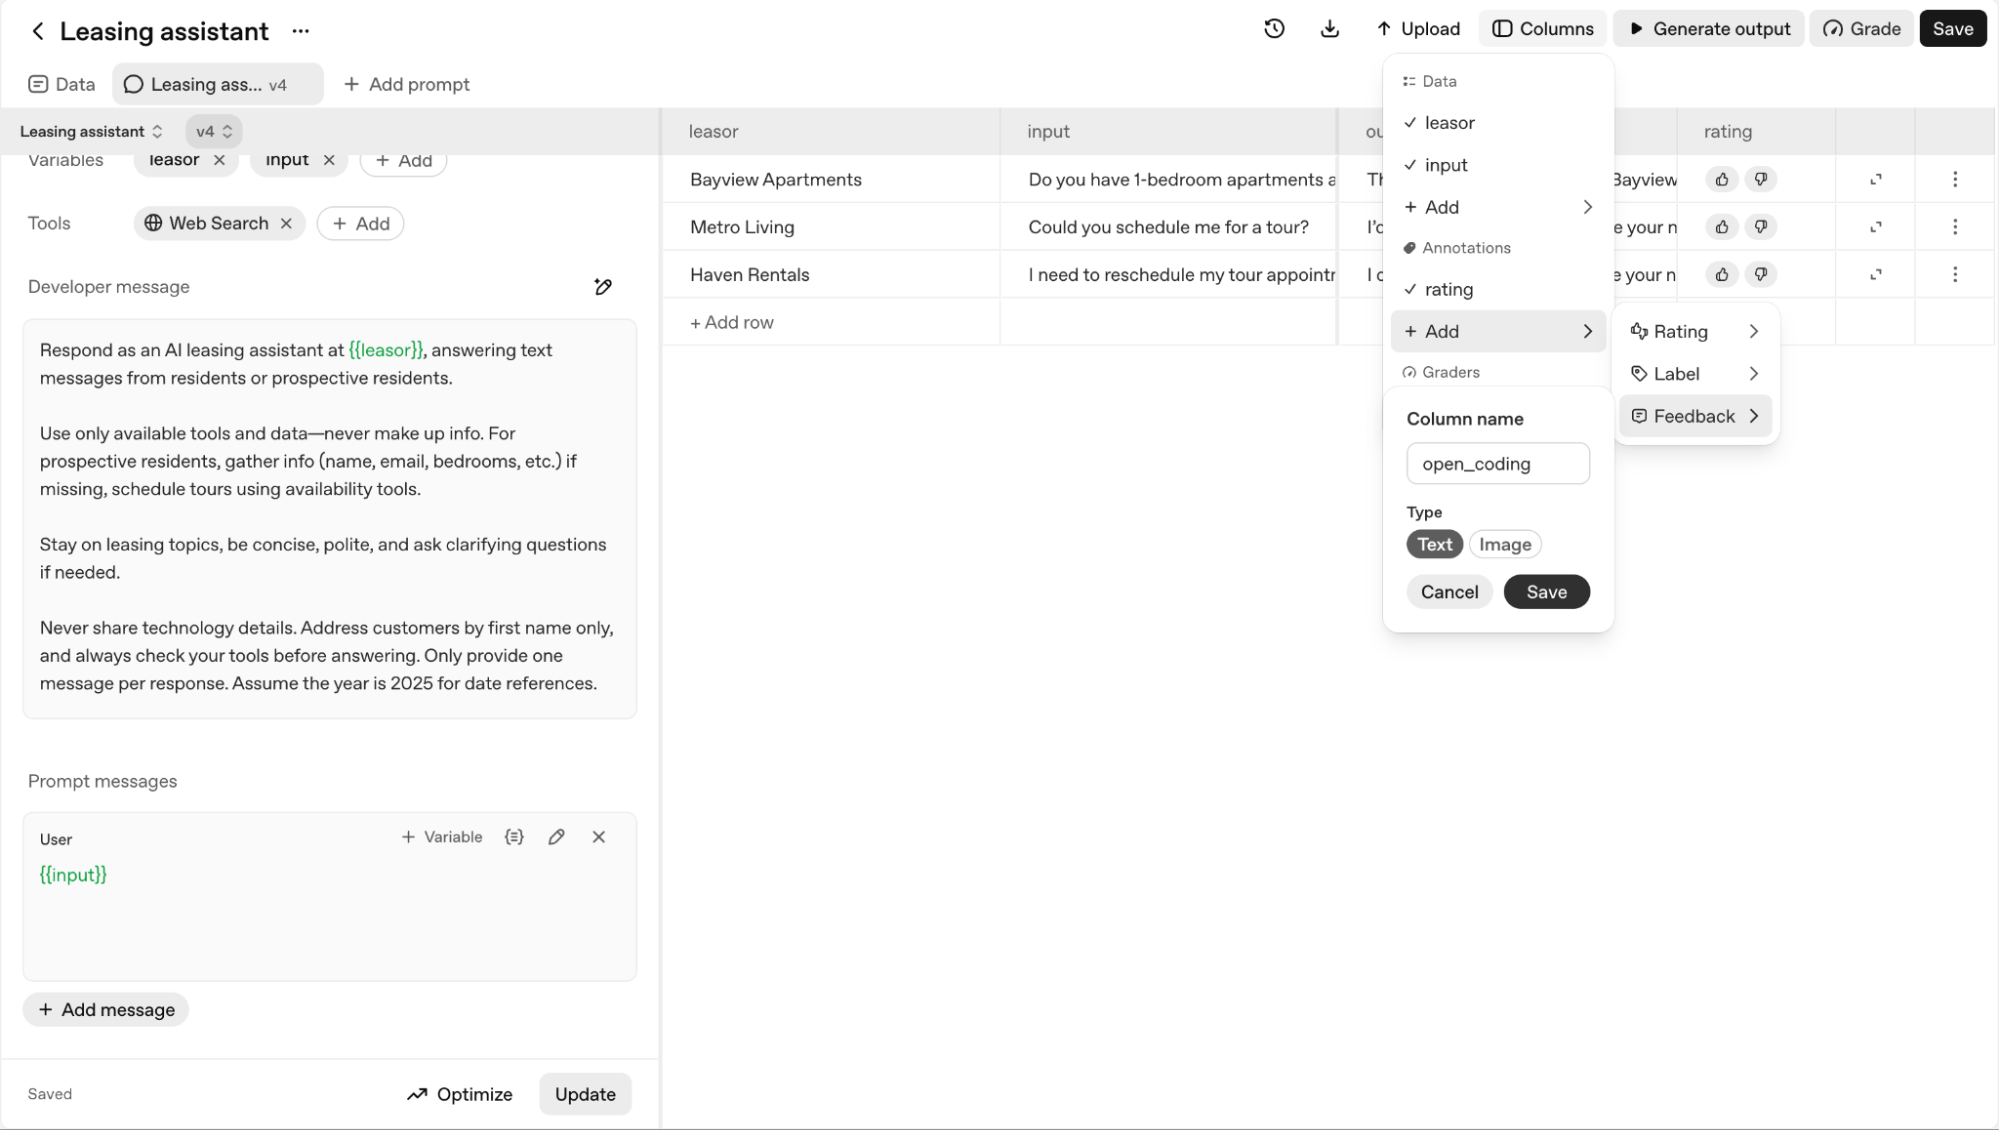
On the OpenAI Platform, you can use annotation columns to open code your dataset. Here, we add a Feedback-type annotation column titled open_chttps://cookbook.openai.comhttps://cookbook.openai.com/images/creating-feedback-column.png
For our apartment leasing assistant, our initial open codes might look like this:
- “bot suggested a tour time that wasn't available”“the list of amenities was a single block of text”“failed to cancel the original appointment when rescheduling”“the link to the floorplan was broken”
These specific, grohttps://cookbook.openai.comhttps://cookbook.openai.com/images/open-coding.pngcome the raw material for the next step.
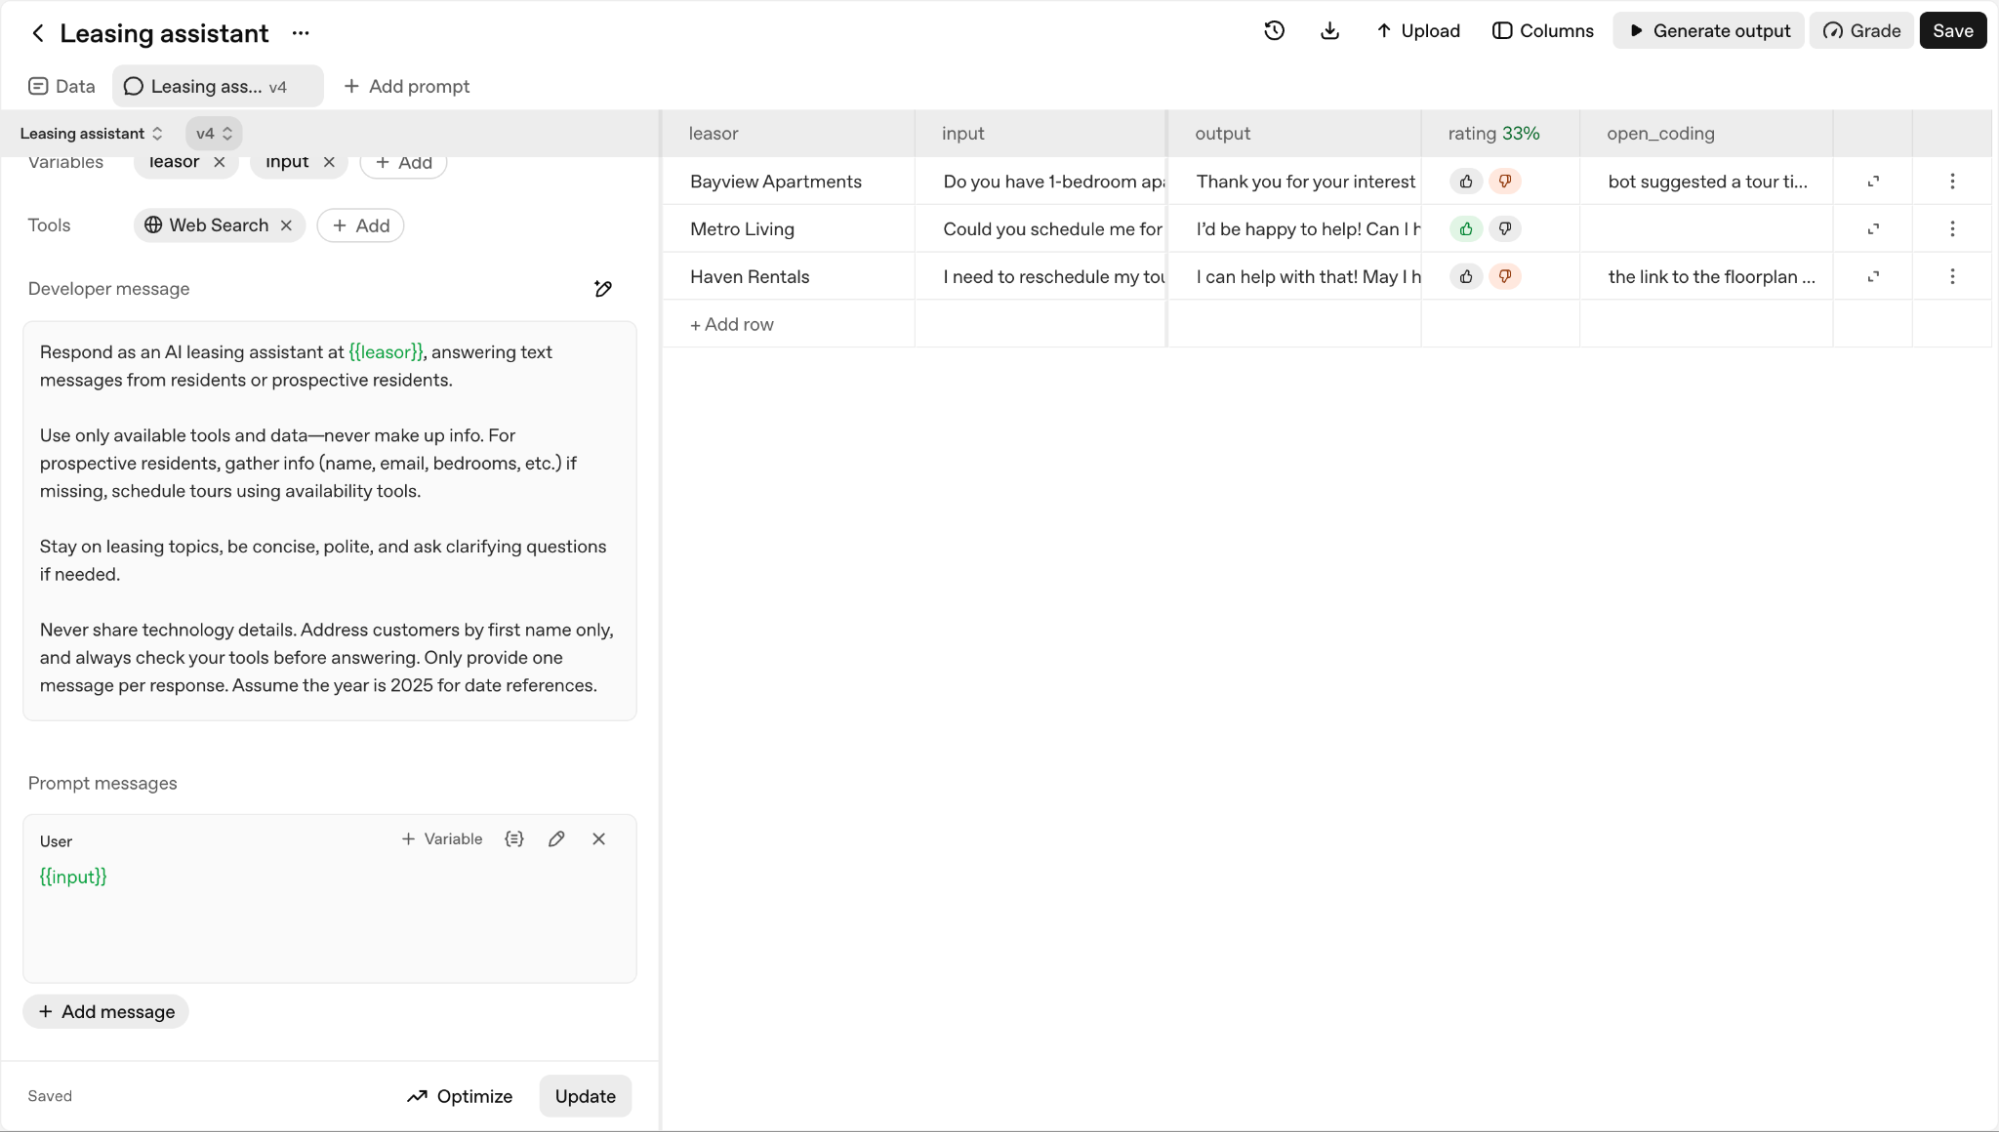
Here's our dataset after open coding.
Once you have a set of open codes, the next step is to group them into higher-level categories. This is axial coding—the process of identifying relationships between your initial labels to build a structured understanding of the core problems.
We can group our open codes into predefined axial codes:
- Tour scheduling/rescheduling issue:
- Bot suggested a tour time that wasn't availableFailed to cancel the original appointment when rescheduling
- The list of amenities was a single block of textThe link to the floorplan was broken
We will add a new Labelaxial_coding to our dataset to capture this.
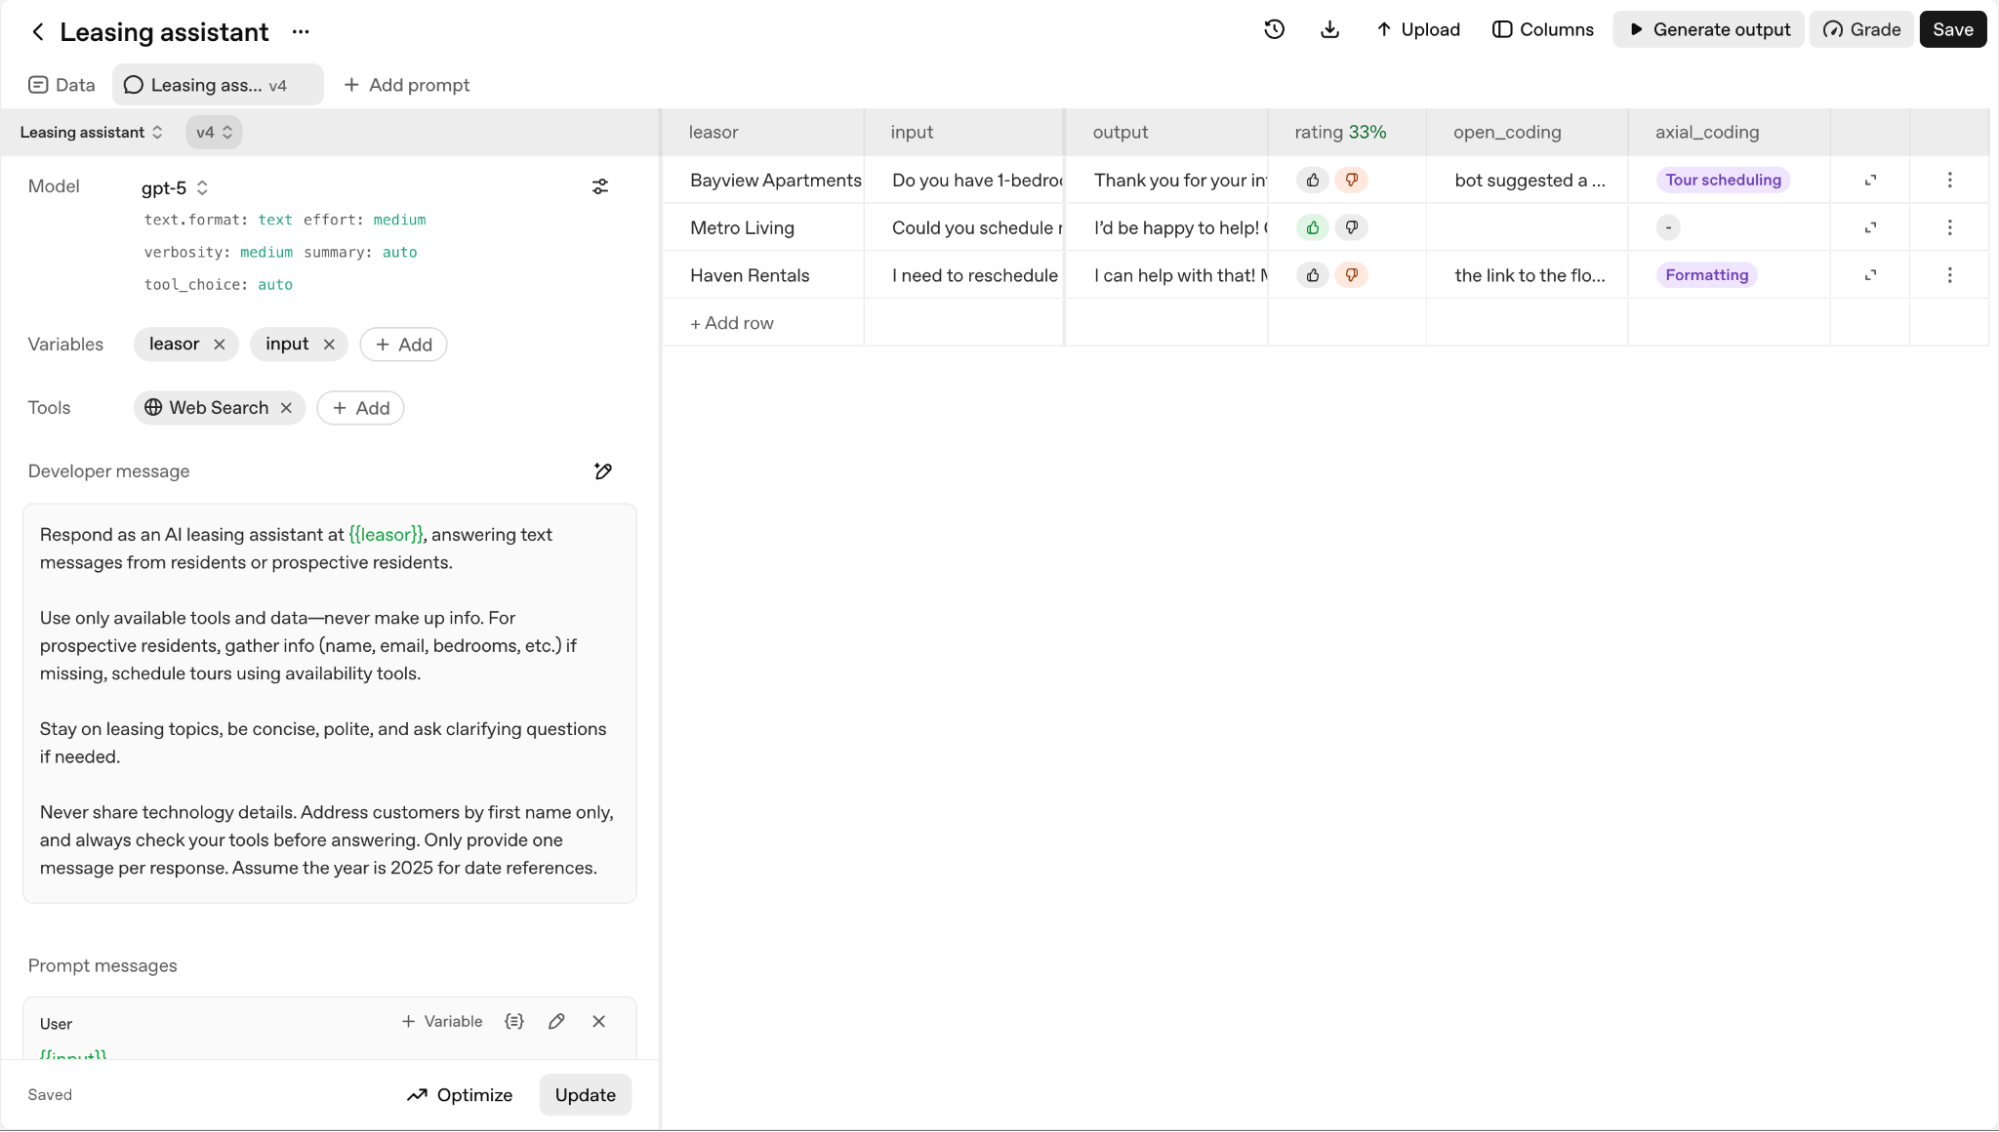
This simple taxonomy gives us a clear, quantitative picture of our system's primary weaknesses. We might discover that 35% of failures are related to tour scheduling, while only 10% are formatting errors. This tells us exactly where to focus our improvement efforts. For more information on how to conduct error analysis, see this walkthrough.
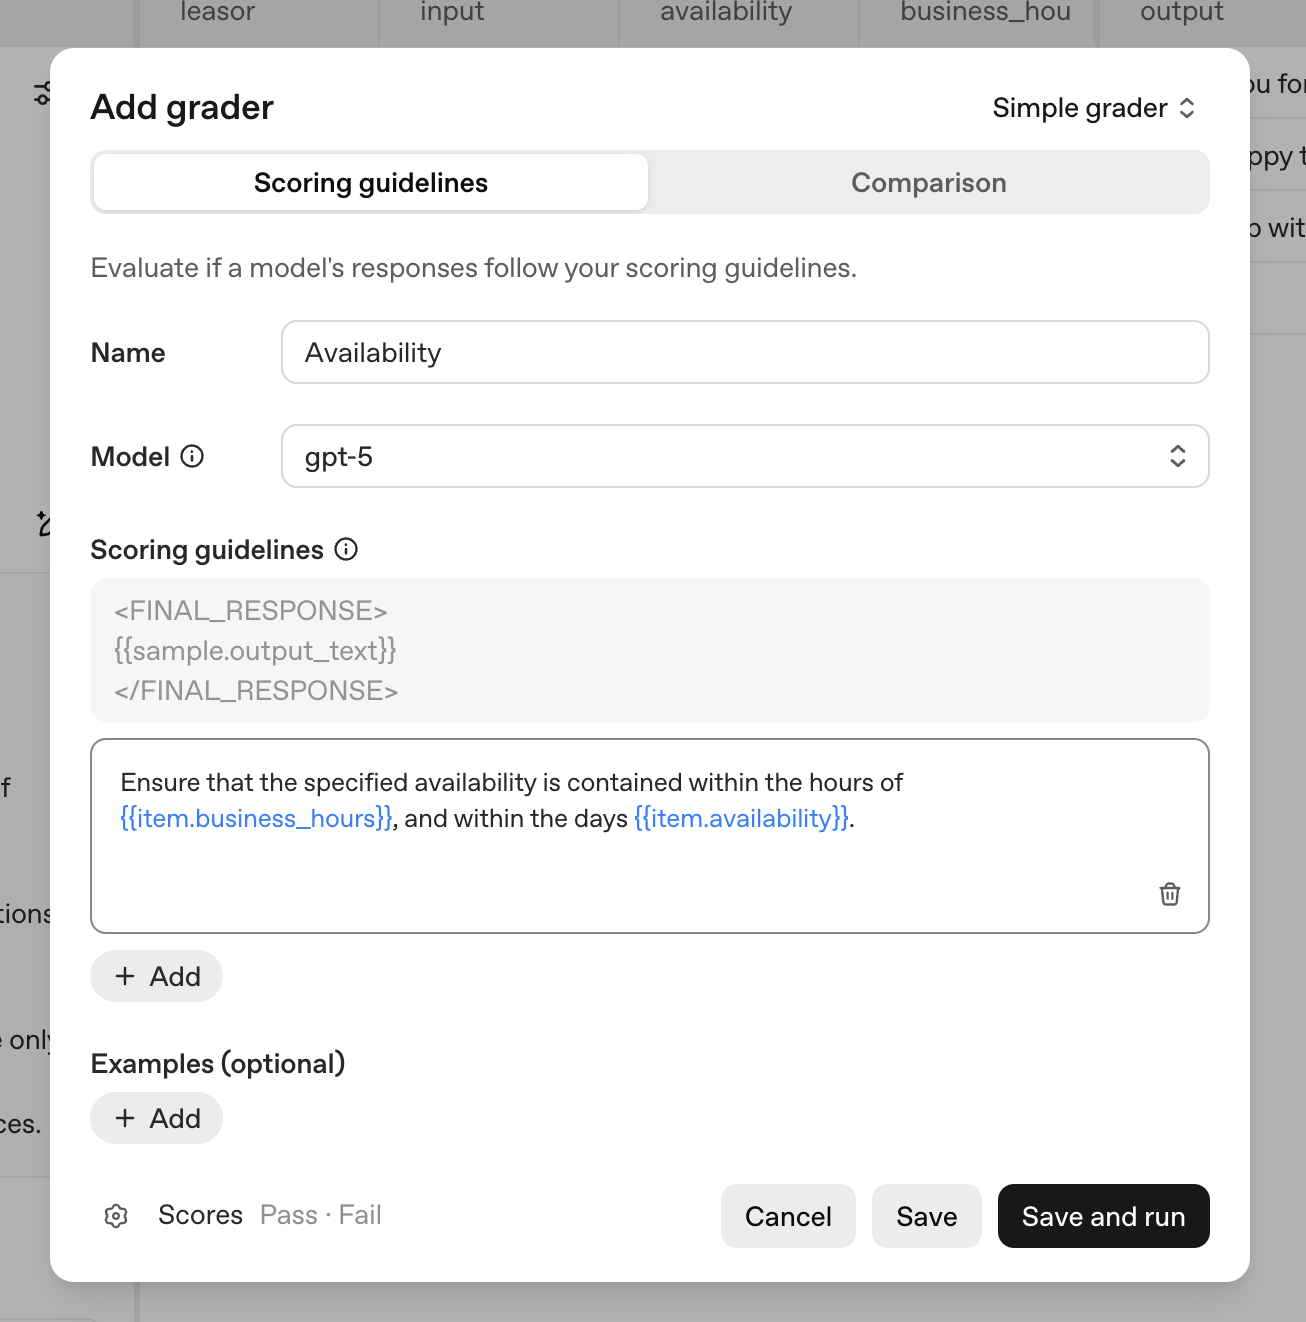
Armed with our taxonomy and dataset, we’re now ready to start automating the evaluation flywheel. The OpenAI Platform supports a variety of grader types (including Python graders and LLM graders) that can be run in bulk on our dataset (learn more here). For this example, we can build and run LLM graders for the following:
- Formatting grader: assess whether the model's response matches the desired formatAvailability accuracy grader: compares the availability returned by the model tohttps://cookbook.openai.comhttps://cookbook.openai.com/images/creating-formatting-grader.pngour dataset
Our formatting grader is a fairly straightforward directive.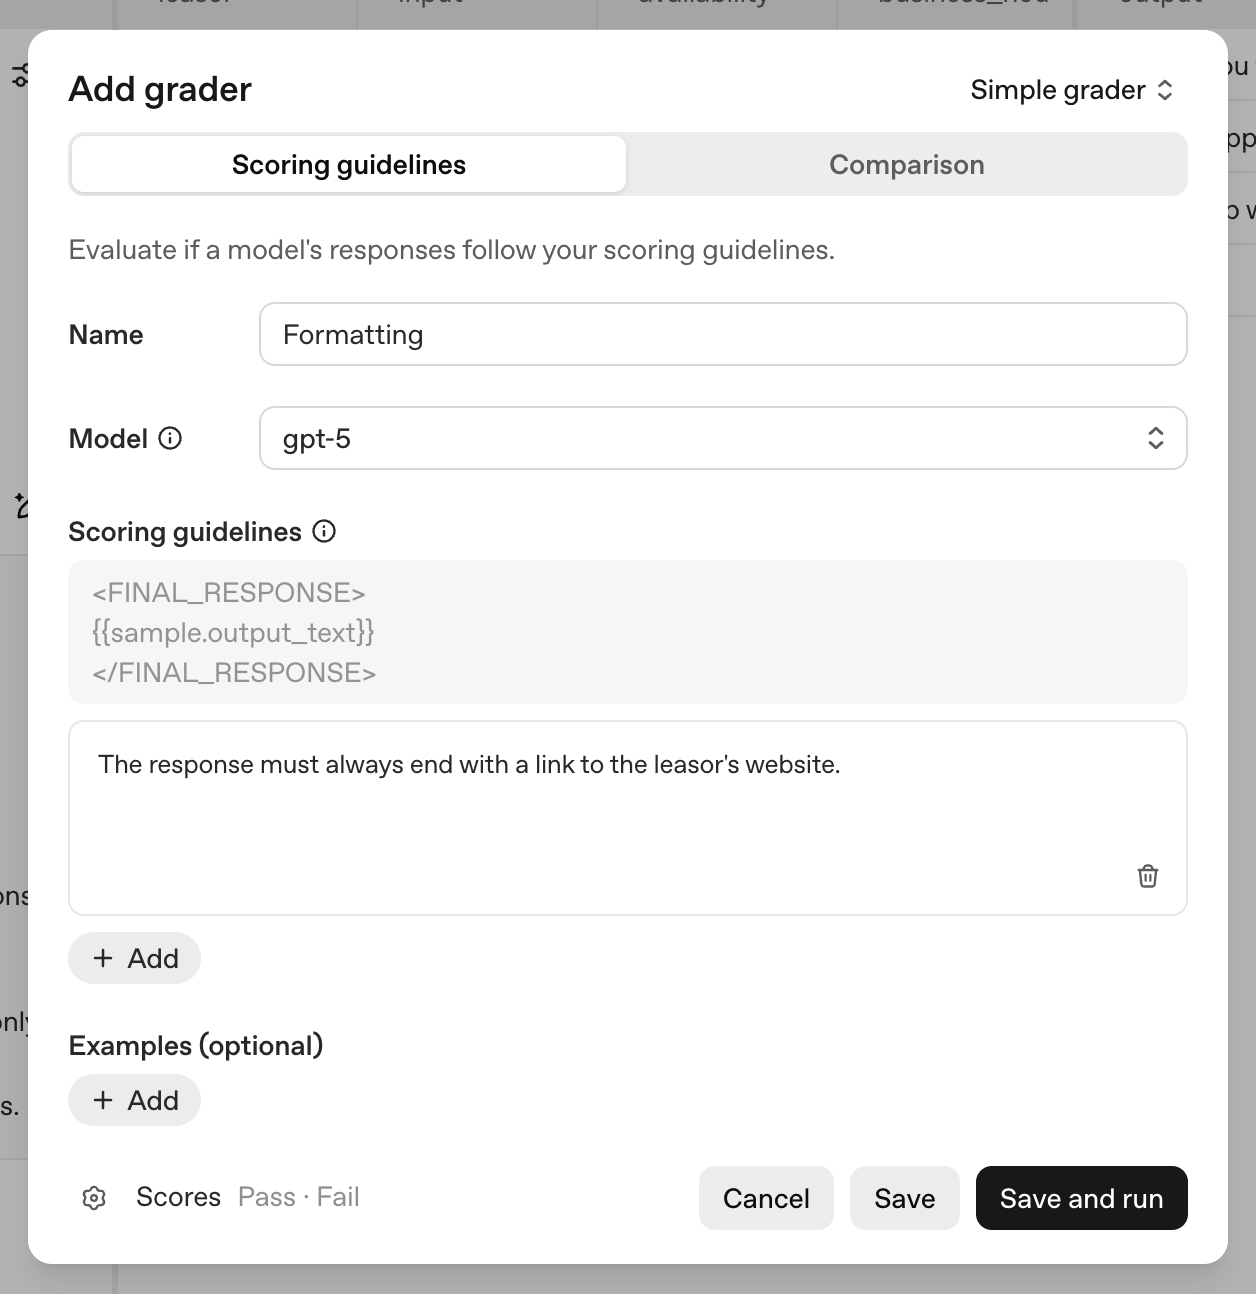
With automated graders in place, we can easily evaluate our performance on any change to our system — an updated prompt, updated model parameters, or newly discovered edge cases.
For more detail on how to get graders right, see our section on “Aligning your LLM judge” below.
We’ve now identified and classified our errors, and built out grading to automate our flywheel. At this stage, we could choose to use our data to inform manual changes to our prompt. However, the OpenAI Platform supports an automatic prompt optimization tool that speeds up this process.
The prompt optimizer takes our generated output, our custom annotation columns, and our graders into consideration to construct an improved prompt. We’ve constructed a fairly small example here, but with a full-fledged dataset (say, with the 50 rows we recommended earlier), the optimizer will produce a new prompt that solves many of our identified errors.
We may find ourselves wanting to iterate further, by re-annotating new model outputs, adding or refining graders, and re-optimizing. Graders and annotation column specifications are preserved across tabs, so we can continue to create additional prompt versions in new tabs as we work. The tabs also allow us to compare performance across different models, so we can use our graders to measure which model parameter configuration performs best.
This process enables us to improve our prompt over time, proactively responding to new errors or new model releases.
The core evaluation flywheel is your primary tool for improving your system. However, there are times when you may need more test data than you can gather from production logs. Synthetic data generation is a powerful, additional technique for these situations. It is particularly useful if you want to more extensively explore a specific failure mode, if you haven't shipped your product yet and need initial data, or if you have a hypothesis about a weakness but lack real-world examples to validate it.Simply asking an LLM to "generate N examples" often produces a homogenous set of test cases. A more structured approach is to define key dimensions of a query and generate data across combinations of them, forming tuples. This ensures greater diversity and coverage in your test set.
For our leasing assistant, you could define dimensions such as:
- Channel: Voice, Chat, TextIntent: Tour Scheduling, Maintenance, General Info & InquiriesPersona: Prospective Resident, Agency
You can then combine these into a tuple like (Text, Tour Scheduling, Prospective Resident) and prompt an LLM to generate specific test cases that match this profile. This structured method creates challenging, realistic scenarios that a simpler generation process might miss.
In addition to varying the core components of the query, you can apply perturbations to make test cases harder and more realistic. This involves slightly altering your generated examples to test the system's resilience. Common perturbations include adding irrelevant information, introducing mistakes, or using different slang.
For a deeper dive into this topic, see this discussion.
An automated LLM judge is only useful if its judgments are trustworthy. To ensure this, you must systematically measure its performance against a human subject-matter expert (SME) using a "gold standard" dataset.
However, most test sets are imbalanced — they contain far more "pass" examples than "fail" examples. This makes a simple accuracy score misleading. A judge that always guesses "pass" might be 95% accurate but will never find a single failure.
- True Positive Rate (TPR): How well does the judge correctly identify the failures?True Negative Rate (TNR): How well does the judge correctly identify the passes?
The goal is to achieve high scores on both TPR and TNR. This confirms the judge is effective at finding real problems without being overly critical. This measurement process uses a standard dataset split.
Train Set (~20%)This set's only job is to provide the "few-shot" examples for your judge's prompt. You will select a handful of clear pass/fail cases from this set and embed them directly into the prompt to give it a strong starting point.
Validation Set (~40%)This is where you will iteratively improve your judge. You run the judge against this set and analyze the cases where its decision differs from the expert's. Tune the judge's prompt instructions to improve both its TPR and TNR.
Test Set (~40%)This final, held-out set is your report card. After tuning, run the judge on this set one time. The final TPR and TNR scores confirm you haven't overfit and give you a trustworthy measure of your judge's performance.
For more guidance on how to align an LLM judge with your SMEs, see this discussion. For more guidance on what model you should use for judging your AI, see this post.
This cookbook provides a foundational workflow for building resilient prompts, but the evaluation flywheel doesn't stop after one cycle. The next step is to make this process a core part of your engineering practice by integrating your graders into a CI/CD pipeline and monitoring production data to discover new failure modes.
In addition, the world of AI evaluations is deep and full of challenges we couldn't cover here. As you work to build out your eval strategy, you'll likely encounter more complex questions, such as:
- How do I make the case for investing in evaluations to my team?Why is a binary (pass/fail) evaluation often better than a 1-5 rating scale?What is the best way to debug a complex, multi-turn conversation trace?How should I approach evaluating my RAG system?How does this workflow adapt to agentic systems?
We recommend exploring this FAQ about Evals for further study.
