
Last week, I was a mentor and judge at Hacklytics 2021, Georgia Tech’s 36-hour datathon. As I interacted with teams during the hacking and evaluation sessions, I noticed patterns among the top teams that help them win. Here’s what I learned about how to do well at a data hackathon under time constraints.
Evaluation criteria for Hacklytics 2021
In case you're interested, here's the predefined criteria that judges were given to evaluate projects.
Technical complexity — 20 points
What technologies were used or explored? We want to reward projects that demonstrate understanding as well as the desire to delve into and learn about unknown skills. This checks if the project has engaged with data science concepts and understands what it means to work with datasets (statistics, insights, exploration, modeling, etc.)
Innovation — 10 points
Is the project something new or rarely seen before? Does it bring a new spin or angle to a known area or topic? What gives this project a “wow” factor?
Completeness — 10 points
How much have they achieved of what they set out to achieve? Is the project deployed or ready to be deployed? How much further effort would be needed to make the project into a full-fledged application or solution?
Design and Visualization - 20 points
Does the project look visually pleasing? Is it something that could potentially be seen and used on a public platform? Most importantly, if it is a visualization project, does the project justify their decisions from the visualizations made, and do they provide any valuable information that was sought?
Presentation - 10 points
How well has the project been presented? Is the purpose and motivation clear? Whats next for the project? Do they have a working demo or prototype?
Minimize data collection; use available datasets & APIs
While hacking, some teams asked how to scrape data from websites. For example, one team wanted to scrape IMDb for data on movie titles, cast, director, ratings, etc.
I advised against it. Scraping data is time-consuming and can be tricky when it comes to dynamically generated content (e.g., via JavaScript). Accurately parsing and extracting fields from raw HTML is a time sink. Instead, I pointed them to publicly available datasets, such as the data provided by IMDb or this Kaggle dataset which has more than 80k titles.
In contrast, most of the winning teams saved time by using readily available, clean data. For example, the team building a fake news detector used a Kaggle dataset of 40k real and fake news articles. Similarly, the overall winner used a Kaggle dataset on COVID Vaccine tweets. The organizers also shared a list of publicly available datasets hackers could use.
What if teams needed recent data for which there’s no dataset? If so, they used APIs. The winning team (finance category) used the Reddit API to get data on r/wallstreetbets posts, including view counts, comments, title, body, etc. The overall winner used the Twitter API to get recent tweets on COVID vaccines. Using these APIs allowed them to focus on other aspects such as sentiment analysis and building user interfaces (UIs).
Use libraries / pre-trained models to speed up ML
Though it was a data hackathon, relatively few teams trained machine learning models.
Many teams used Vader for sentiment analysis. Its simple API and great examples made it easy for beginners to pick up—three of the winning teams applied Vader on tweets and Reddit posts. Another winning team used a combination of afinn and text2emotion.
Some teams used pre-trained models. The team building a fake news detector started with pre-trained BERT and fine-tuned it on their fake news dataset for three epochs. The winning team of the athletics (track & field) category started with pre-trained 3D human pose estimation models to detect when athletes jump over hurdles.
Familiarity with front-end is useful
Most of the winning teams built simple UIs that made their ideas more concrete.
The winner of the healthcare category built Clinical Model Tuner to let physicians upload existing models and fine-tune them on additional data (i.e., inverse federated learning). They built a React app that demonstrated this well. Users could upload pre-trained models, datasets, and labels to fine-tune models. After fine-tuning, users could also see the improvements to model evaluation metrics.
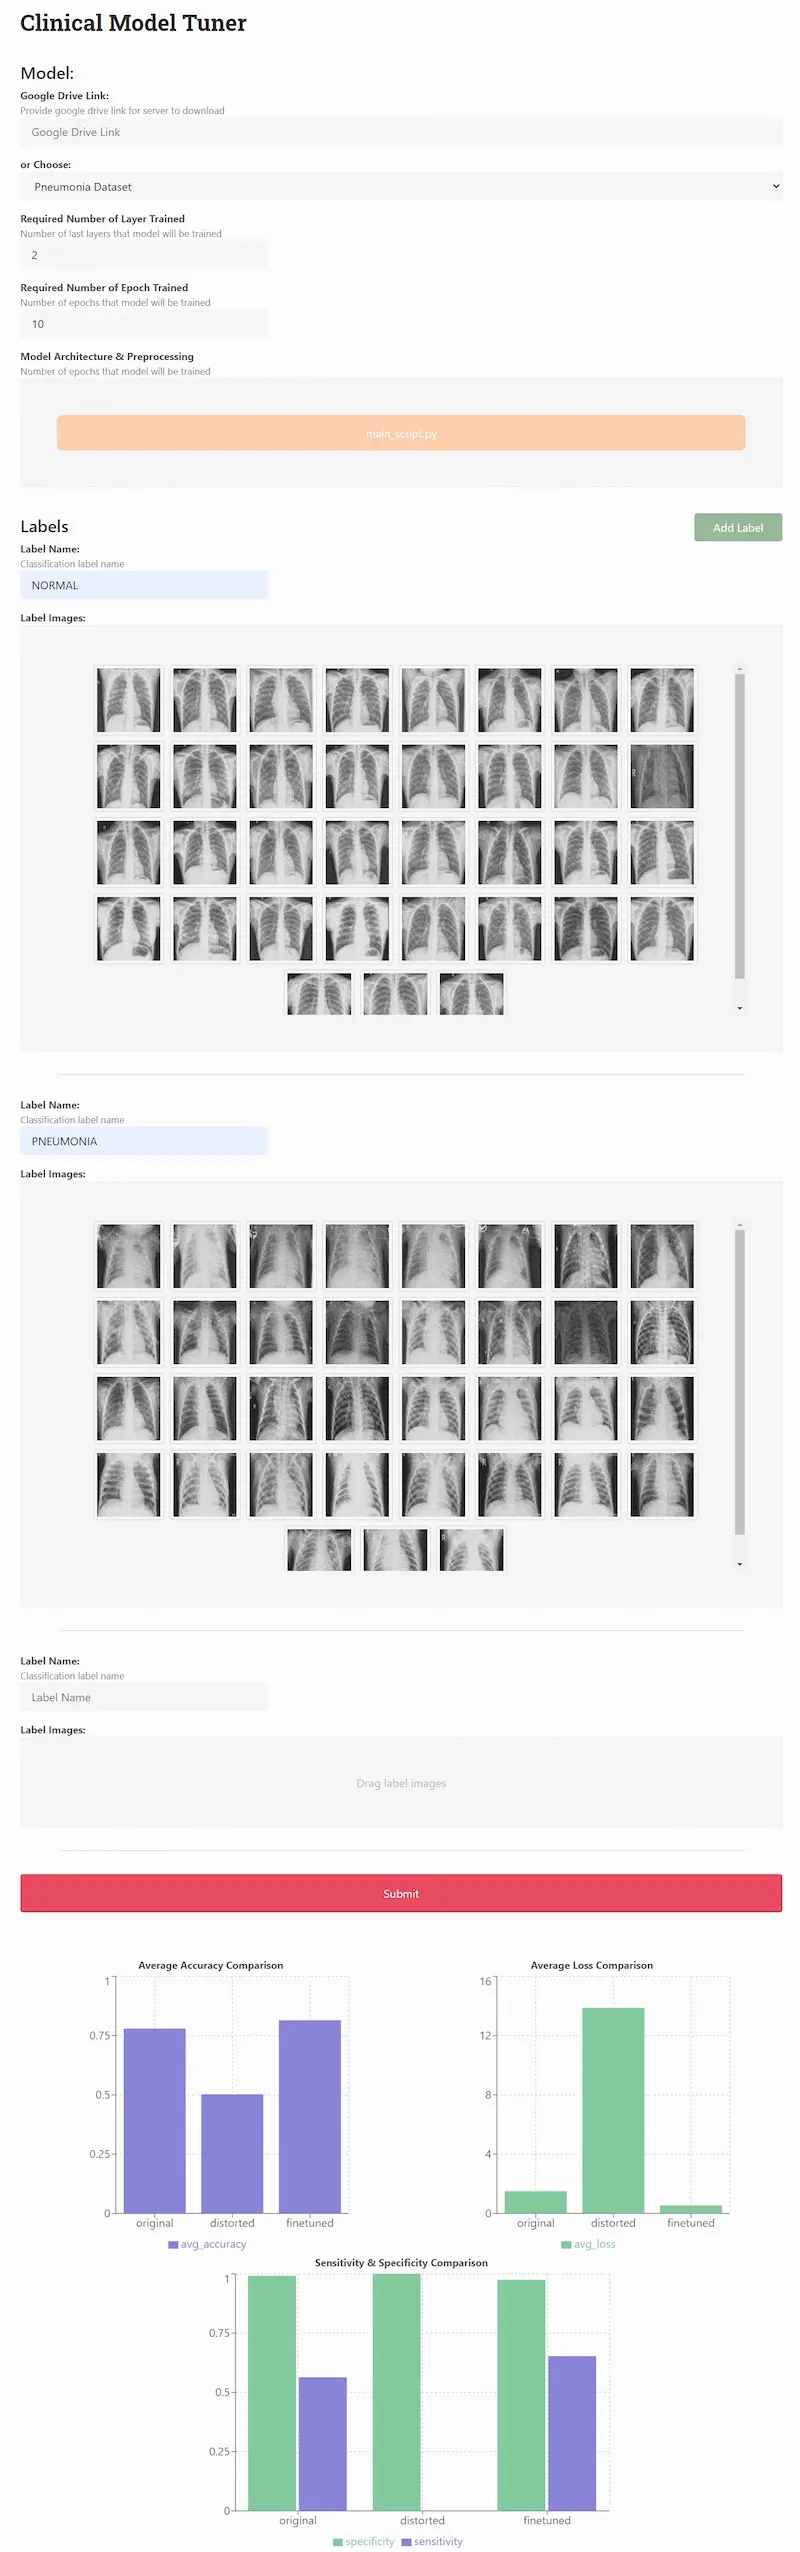
User interface of Clinical Model Tuner (thanks to the team)
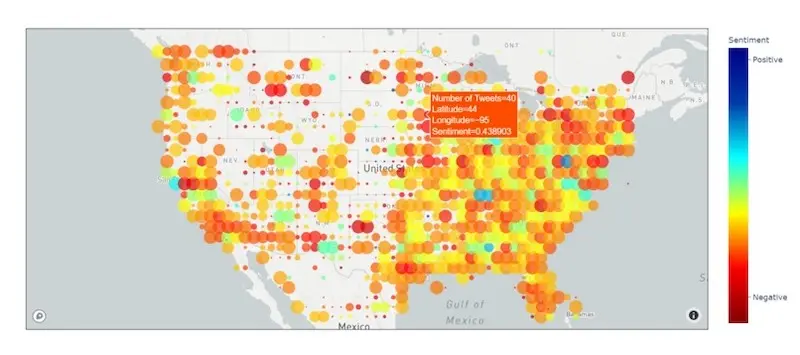
Another team performed sentiment analysis on r/wallstreetbets posts and visualize the correlation between a stock’s sentiment and its price movements. They also built a React app that allowed users to see Reddit posts on each stock and their associated sentiment, as well as price movementhttps://eugeneyan.com/assets/wolf-of-wsb.webpsets/wolf-of-wsb.webp" loading="lazy" title="User interface for Wolf of WallStreetBets" alt="User interface for Wolf of WallStreetBets">
User interface of Wolf of WallStreetBets
Some teams also used python libraries to quickly build interactive UIs. The winner of the athletics (football) track used Streamlit to build a dashboard to show the football and social media statistics of potential recruits to help teams make better decisions. The overall winner built an interactive Plotly dashboard to visualize public sentiment towards COVID vahttps://eugeneyan.comhttps://eugeneyan.com/assets/covid-tweets.webpp>
User interface for Voices of the Vaccine (source)
That said, it was not absolutely necessary to use React or libraries. The TickerTrakr team won the best visuals award with a simple combination of Flask, HTML, CSS, and JavaScript.
Knowing how to deploy is useful
Many of the winning teams had prototypes deployed. This made the difference between offline experimentation and a live demo that felt much closer to reality.
The RealityCheck wrapped a Flask app around their fine-tuned BERT model and deployed it on Google Cloud Platform. This let them demo their Chrome extension which allowed users to enter news snippets and get the probability of it being fake news.
Some teams even made their prototypes publicly available so other participants and judges could interact with them. Some of thehttps://eugeneyan.comhttps://eugeneyan.com/assets/hurdle-tracker.webp of 2021-02-14):
![]()
User interface of Hurdle Tracker
Conclusion
Training bespoke machine learning models wasn’t a differentiating factor at this hackathon. Instead, what made a difference was:
- Using readily available data via public datasets or APIs Using libraries / pre-trained models to speed up ML iteration Building UIs to make machine learning and insights easy to consume Deploying models and UIs so people can use them
Similar to building machine learning systems in industry, no?
Thanks to Yang Xinyi for reading drafts of this.
If you found this useful, please cite this write-up as:
Yan, Ziyou. (Feb 2021). How to Win a Data Hackathon (Hacklytics 2021). eugeneyan.com. https://eugeneyan.com/writing/how-to-win-data-hackathon/.
or
@article{yan2021hacklytics, title = {How to Win a Data Hackathon (Hacklytics 2021)}, author = {Yan, Ziyou}, journal = {eugeneyan.com}, year = {2021}, month = {Feb}, url = {https://eugeneyan.com/writing/how-to-win-data-hackathon/}}