
Design patterns are reusable, time-tested solutions to common problems in software engineering. They distill best practices and past knowledge into pragmatic advice for practitioners, and provide a shared vocabulary so we can collaborate effectively.
Here, I’d like to share a couple of patterns I’ve seen in machine learning systems. Some of them, such as process data once and evaluate before deploy, may seem basic to seasoned practitioners. Nonetheless, I’m including them because they’re essential, and surprisingly, not all teams adopt them. Please skip them if you’re already familiar with them.
(If you like this, you may also be interested in a previous post on design patterns in ML code, largely inspired by the classic Gang of Four book.)
Process Raw Data Only Once: To reduce redundancy
A key pattern when designing data pipelines is to process and aggregate raw data just once, preferably early on. This way, we can work with the processed data downstream instead of reading and computing over the raw data again and again.
- Pros: Reduces redundancy and streamlines data processing jobs, making pipelines more efficient and maintainable. This reduces compute and storage costs. Cons: It can be challenging to process and aggregate data in a way so it flexibly supports various use cases. And if we try to please everyone, we lose the benefits of early processing and might be better off working with the raw data.
Imagine we’re part of an e-commerce company that tracks user behavior via clickstream logs. The logs capture pages they visit, products they viewed, and actions they took (e.g., click, add-to-cart, purchase). This dataset is enormous (one object per event) and in a format not suited for analytics, such as in a Kafka queue as JSON instead of tables.
To build a dashboard for the conversion funnel, we’ll want to group logs by session and aggregate metrics on page visits, click-through rate, add-to-cart rate, conversion rate, etc. You can imagine other teams wanting to do similar analysis on this data too. Thus, instead of multiple teams building duplicate pipelines to process the raw data, we can process it once and store it in a tabular format for everyone to use. This way, we can efficiently query the processed or aggregated data for analytics and machine learning.
Similarly, if we wanted to build a session-based recommender that recommends products based on a user’s in-session events, we could aggregate the data by session to get arrays of events ordered by time. This way, multiple teams can train their recommenders on these sequences instead of processing the raw logs from scratch during every training run.
The natural extension of this pattern is the feature store pattern which centralizes feature computation and storage. Feature stores enable feature reuse and consistency across applications, and reduce duplicate effort, compute, and storage.
Human-In-The-Loop: To collect explicit labels
If our ML system involves supervised learning, we can’t get away with not having labels. And if we don’t have labels—such as when we’re solving a new problem—we can apply HITL to collect them. We can collect labels explicitly (e.g., annotation) or implicitly (e.g., organic clicks, purchases). This section will focus on collecting explicit labels.
- Pros: Human annotators can deal with ambiguous or complex examples where heuristics or automated methods might fail. Also, collecting input from domain experts can ensure labels reflect the nuances of reality and their expertise. Cons: Human annotation is expensive and takes time, making it a bottleneck.
One way to collect labels is to ask users directly. For example, Stack Exchange lets users flag posts as spam and then uses these labels to train spam detection models. Similarly, LinkedIn relies on users to report messages as harassment while Uber receives fraud reports when users dispute charges or file a chargeback.
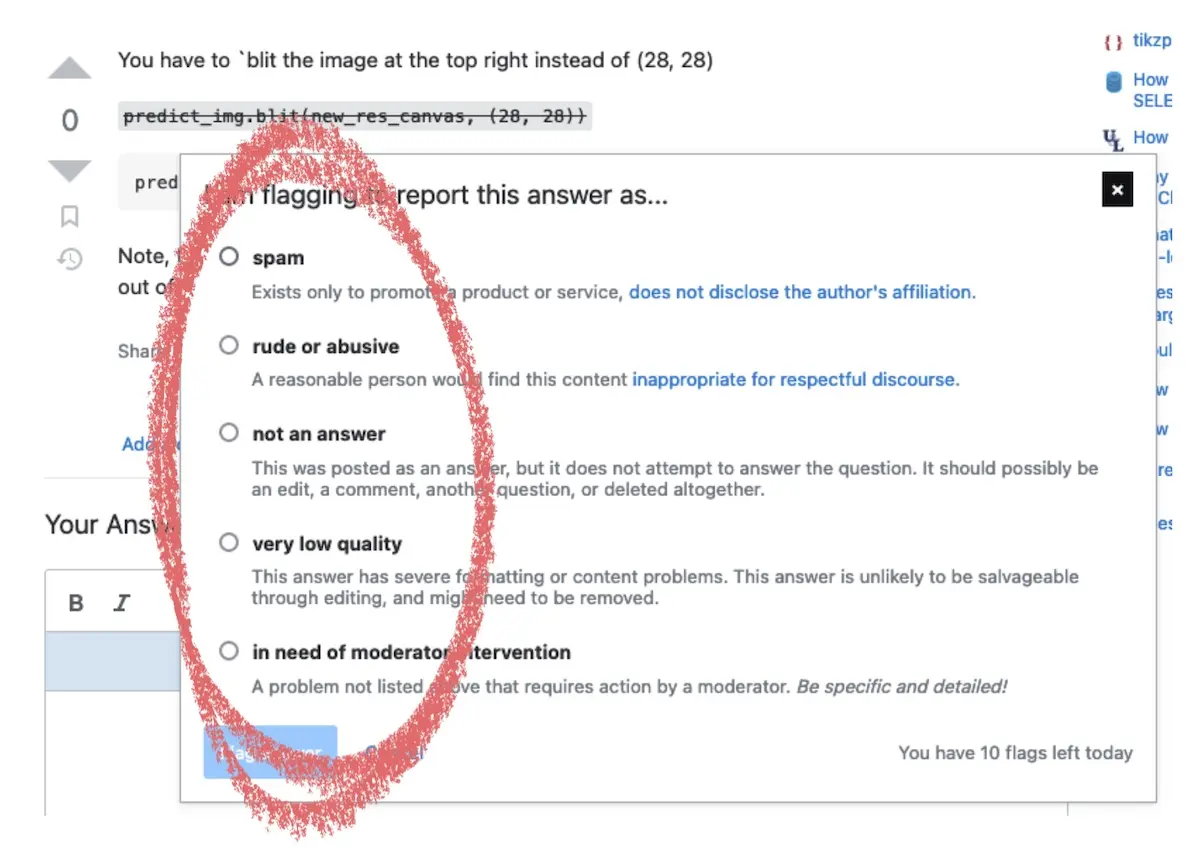
Flagging a post as spam, abusive, low quality, etc on Stack Exchange
Another approach is to use third-party or internal annotation services. For example, DoorDash used a mix of Mechanical Turk and professional annotators to categorize menu items by cuisine style, flavor, etc. Similarly, Airbnb relied on HITL to categorize listings into various groups such as places of interest, activities, home types, and more.
As an example of having expert annotators, Uber had internal analysts review fraud trends. These experts analyzed and identified new fraud patterns that machine learning models trained on past data might missed (i.e., false negatives), before crafting heuristics to programmatically identify them in future transactions. They also confirmed whether flagged transactions were indeed fraudulent (i.e., true positives).
That said, we may not require as much HITL in the future. Recent studies have found large language models (LLMs) to perform on par, or better than, people at labeling ground truth.
For example, a study found that gpt-3.5-turbo outperformed Mechanical Turk workers for four out of five annotation tasks (relevance, topic detection, stance detection, and frame detection) on 2,382 tweets. Furthermore, the cost was less than $0.003/annotation, making it 5% of the cost of Mechanical Turk per annotation.
Another study used gpt-4 to classify the political affiliation of Twitter users based on their tweets. Here, LLMs not only outperformed experts and crowdsourced workers in terms of accuracy, they also had higher inter-rater reliability. Even when the crowdsourced and expert labels were ensembled via majority vote, LLMs still performed bettehttps://eugeneyan.com/assets/llm-annotation.webps/llm-annotation.webp" loading="lazy" title="LLMs outperform crowdsource and expert annotators, even when the latter is ensembled" alt="LLMs outperform crowdsource and expert annotators, even when the latter is ensembled">
LLMs outperform crowdsource and expert annotators, even when the latter is ensembled
Data Augmentation: To increase data size and diversity
Data augmentation is the process of artificially increasing the size and diversity of training data by generating new examples from existing data.
- Pros: Valuable when ground truth data is limited, imbalanced, or lacks diversity. Data augmentation can make training data more representative and varied, thus helping to improve model generalizability and reduce overfitting. Cons: Challenging to apply to tabular data (compared to image and text data). It can also be tricky to ensure that synthetic data matches the distribution of actual data.
The classic example of data augmentation is in computer vision. In this PyTorch example, images are augmented through geometric transforms such as cropping, rotation, and flipping, as well as color transforms such as grayscale, blurring, and inversion. These simple transforms increase the volume and diversity of training data, improving the performance of CV models while reducing the cost of data collection and labeling.
An example of data augmentation on text comes from DoorDash. They varied sentence order in food descriptions and randomly removed information such as menu categories. This helped simulate the variation in real-world menus where merchants don’t always have detailed descriptions or menu categories. When training their models, they used a ratio of 100 synthetic lahttps://eugeneyan.comhttps://eugeneyan.com/assets/text-augmentation.webpp>
Data augmentation on text via varying sentence or word order
Besides data augmentation, another way to expand the dataset is by creating synthetic data. For example, Cloudflare generated synthetic data to increase the diversity of their training data that is used to train models to classify malicious HTTP requests.
To create negative samples, they generated pseudo-random strings based on a probability distribution of existing tokens in the training data. They also made it harder by adding complex tokens such as valid URIs, user agents, XML content, and even “dangerous” n-grams that frequently occur in malicious payloads. The goal was to desensitize the model to individual tokens and keywords and have it focus on the higher-level structural and semantic aspects of the payload. This reduced the false positive rate by ~80%.
Similarly, Meta used synthetic data generators to create sensitive data such as social security numbers, credit card numbers, addresses, etc. Uber also generated synthetic data, based on their experience with and assumptions of fraud attacks, to validate their anomaly detection algorithms during automated testing of data pipelines. Libraries such as Faker makes it easy to generate fake names, addresses, phone number, and more.
Hard Negative Mining: To get difficult samples
Hard mining can be considered an extension of data augmentation where we find or generate challenging data points to train the model on. The intent is to improve model performance on these difficult cases by exposing it to more of them during training.
- Pros: Often leads to improved model performance. At the very least, we can better measure how our models perform on these difficult cases. Cons: Finding these hard examples can be, well, hard. It’s also not as simple as training the model solely on these hard examples too (see Meta example below).
One approach to hard mining is to analyze model predictions for misclassified or low-confidence examples, find similar examples (e.g., nearest neighbors), and emphasize them in subsequent training. This forces the model to learn from its mistakes and improve.
When Meta built embedding-based retrieval for search, they used hard mining to address the problem of easy negatives in the training data (i.e., random negatives). Easy negatives led to the model performing poorly on harder negatives. Counterintuitively, they found that models trained on hard negatives did not perform better than models trained on random negatives. This was because the hardest negatives did not reflect actual search behavior on Facebook where most documents (e.g., people, places) were relatively easy.
Through experimentation, they found that sampling hard negatives from rank 101 - 500 (in the search results) led to the best performance. Overall, blending random and hard negatives improved recall, saturating at an easy:hard ratio of 100:1. (DoorDash also had this ratio of synthetic to actual labels when training their models.)
Another approach is to blend hard negatives in curriculum learning, where the training data is sorted to gradually increase sample difficulty. The model starts learning from easy samples before progressively tackling harder samples as it becomes more capable.
Cloudflare adopted this approach by training their malicious payload classifier on easy synthetic data, followed by increasingly difficult synthetic data, before finally fine-tuning on real data. To make the task harder, they appended noise of varying complexity to malicious and benign samples, with the goal of making the model more robust to padding attacks. This improved the true positive rate for fuzzed content from 91% to 97.5%.
Reframing: To simplify the problem or label
To reframe is to make a problem easier to solve by refining the initial problem statement or transforming the target feature. For example, we might reframe a regression problem into a classification problem, and vice versa.
- Pros: Can lead to large model or business metric improvements without too much effort, especially if we’re just transforming the label or using a different technique. Cons: Uncommon to successfully reframe a problem. Successful examples are infrequent and it’s more art than science.
For Amazon’s semantic search, the team initially had a binary label: purchased or not. They then used a two part-hinge loss where \(\hat y\) is the cosine similarity between query and product embeddings, and \(y = 1\) if the product is purchased (in response to the query) and zero otherwise. The hinge loss ensured that \(\hat y > 0.9\) when \(y = 1\) and \(\hat y < 0.2\) when \(y = 0\).
However, they found a large overlap in score distribution (left in image below) between the random negatives (red) and purchased positives (green). After some analysis, they found that this was due to products that were impressed but not purchased. Thus, they updated their target label to distinguish between products that were impressed but not purchased (grey) and random negatives (red). They also used a three-part hinge loss, where \(\hat y < 0.55\) if the product was impressed but not purchased. This improved the separation of scores between random negahttps://eugeneyan.comhttps://eugeneyan.com/assets/amazon-search-hinge-loss.webpgreen).
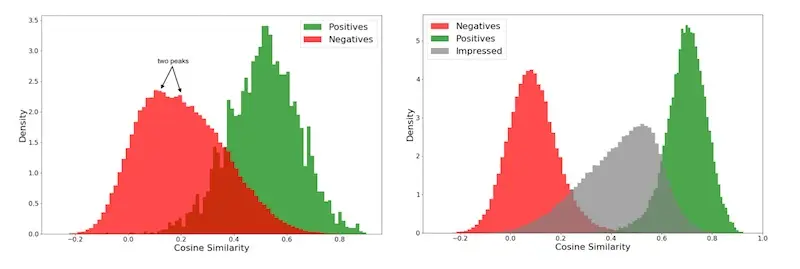
Score distribution with two-part (left) and three-part (right) hinge loss
Another example of reframing is Shopify’s product classifier. To simplify the problem of classifying items into a 5,000 class, hierarchical taxonomy, they converted n one-vs-all classifiers into a single binary classifier. They did this by exploding the training data to create a row for each category for each product, and then appending the category to the features. Finally, if the product-category pair is valid, it gets a label of 1, and 0 otherwise. They also considered hierarchy by giving parents of a valid category a label of 1.
This allowed them to train a single logistic regression model instead of \(n\) individual classifiers, reducing computation cost and keeping the system simple. Accounting for parent-child relationships also enabled them to learn from the taxonomy structure.
During inference, they start at the root level category, categorizing the product into the top-level node with the highest score. This continues by scoring the product for each of the node’s children, pickinghttps://eugeneyan.comhttps://eugeneyan.com/assets/shopify-classification.webpntil the leaf node is reached.
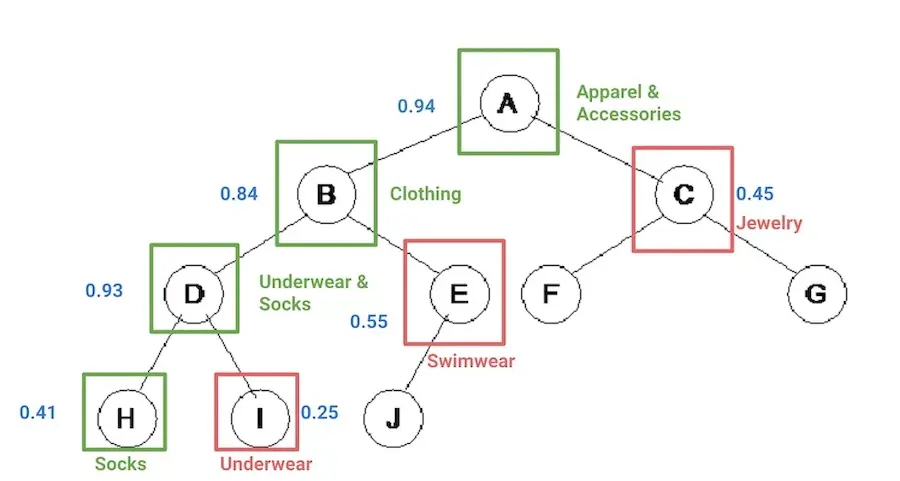
Categorizing products by traversing through the product taxonomy
A final example is the reframing of recommendations from the co-occurrence problem (e.g., matrix factorization) into a sequential problem (e.g., RNNs, Transformers). One of the earliest papers to do this applied GRUs for session-level recommendations. It was motivated by the need to learn from short, session-level data due to the lack of long user histories (such as those that Amazon or Netflix has).
Since then, a large portion of recsys research has shifted towards the sequential paradigm, such as Self-Attentive Sequential Recommendations, Behavior Sequence Transformer, BERT4Rec, and more. Empirically, these approaches have been more effective than co-occurrence techniques though the latter remains a competitive baseline.
Cascade: To split a problem into smaller problems
The cascade pattern splits an initial problem into smaller problems that can be solved sequentially. Thus, each subsequent model or system focuses on an increasingly difficult or smaller subset of the data. This is similar to the ensemble pattern but considers order.
- Pros: Allows cheaper heuristics and models to chip away at the problem upstream before the harder cases are sent downstream to costlier but more precise models. This improves overall efficiency and system performance. Also makes it easier to structure teams that can independently focus on each step of the cascade. Cons: Can lead to unintended coupling or degenerate interaction effects, where downstream models may overly rely on upstream models to act in a certain way.
A classic example of a cascade is recommender system design, usually split into retrieval and ranking steps. Retrieval is a fast but coarse step to narrow down millions of items into hundreds of candidates. Ranking is a slower but more precise step to score the retrieval candidates. Structuring it as a cascade allows each step to optimize for different objehttps://eugeneyan.comhttps://eugeneyan.com/assets/twitter-recsys.webpfor recall and speed while ranking optimizes for precision.
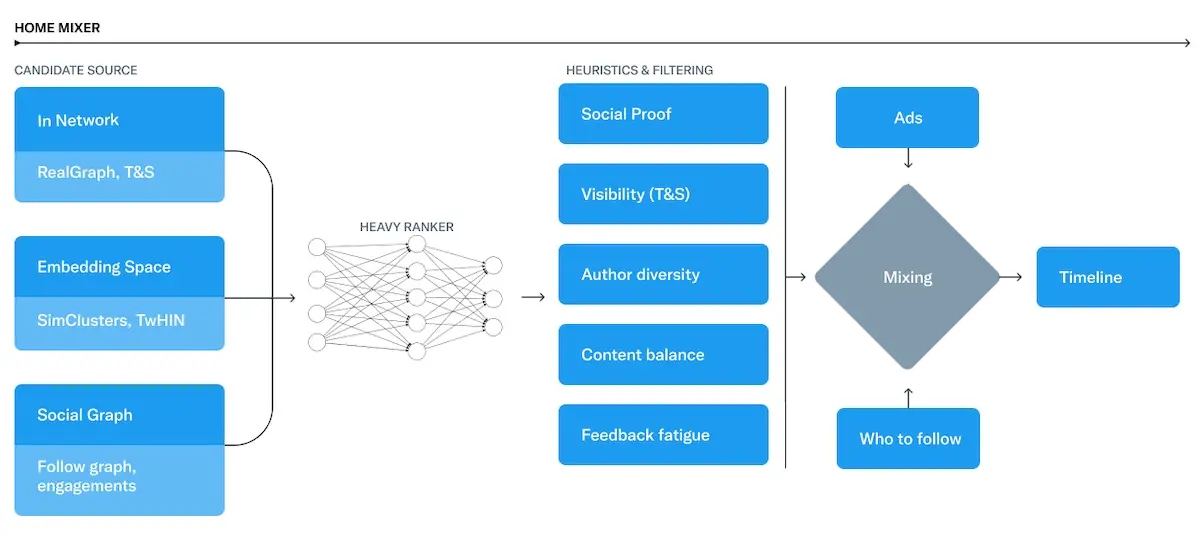
Candidate retrieval -> ranking -> heuristics & filtering -> ads blending
Twitter’s recently open-sourced recsys follows this pattern (image above). Their recsys is a cascade of (i) candidate sourcing (aka retrieval), (ii) heavy ranking, (iii) heuristics and filtering, and (iv) ads blending. Multiple components contribute to retrieval before the heavy ranker (a parallel masknet) does the ranking. Finally, business rules are layered on.
Stack Exchange also adopts a cascade pattern to identify spam. It starts with identifying users that post too often to be humanly pohttps://eugeneyan.comhttps://eugeneyan.com/assets/se-spam.webpis then slapped with an HTTP 429 Error (Too Many Requests) and blocked or rate-limited.
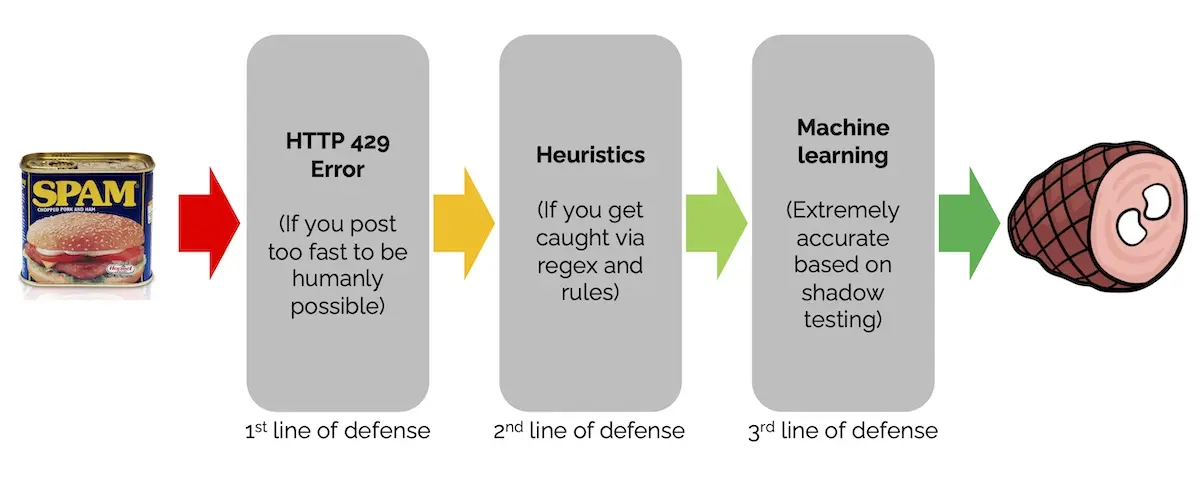
Three layers of defense against spam: Post rates -> heuristics -> machine learning
The second step in the cascade is based on heuristics. Specifically, they run posts through an “unholy amount of regular expressions” and some rules. If a post is caught, it is sent to users to check and potentially flag it as spam. If enough users flag it as spam, the post is marked as spam and the spammer is blocked, rate-limited, or prevented from posting.
The final line of defense is a (machine learning?) system that identifies posts most likely to be spam. They shadow-tested it and found it to be extremely accurate, catching almost all of the blatantly obvious spam. Eventually, this system was armed to cast three automatic flags, drastically reducing the time to spam post deletion.
Data Flywheel: To continuously improve & build a moat
The data flywheel pattern revolves (pun intended) around continuously collecting data which then improves models which then improves user experience. This leads to more usage, which leads to more data to further improve models, creating a virtuous cycle.
- Pros: One of the few sources of long-term competitive advantage. While model architecture and system design can be copied, they’re moot without the data. Cons: It can lead to a feedback loop where bias perpetuates (e.g., popularity bias in recsys) though data augmentation can alleviate this.
A prime example of the data flywheel is the recommendation systems at Amazon and Netflix. When users look for their next show on Netflix, their searches, clicks, previews, watch time, and ratings are logged. This data is then used to build recsys that learn from their preferences and serve personalized recommendations. As a result, users spend more time on Netflix, generating more data which further improves the recommendations.
Another example is Tesla’s Autopilot. Tesla collects driving images and videos from its vehicles as a data source. From this data, they identify errors, find similar instances (e.g., nearest neighbors), and label them. These new labels are then used to retrain models which arehttps://eugeneyan.comhttps://eugeneyan.com/assets/tesla-data-engine.webpmed with the new models, the vehicles then gather more driving data, completing the data flywheel.
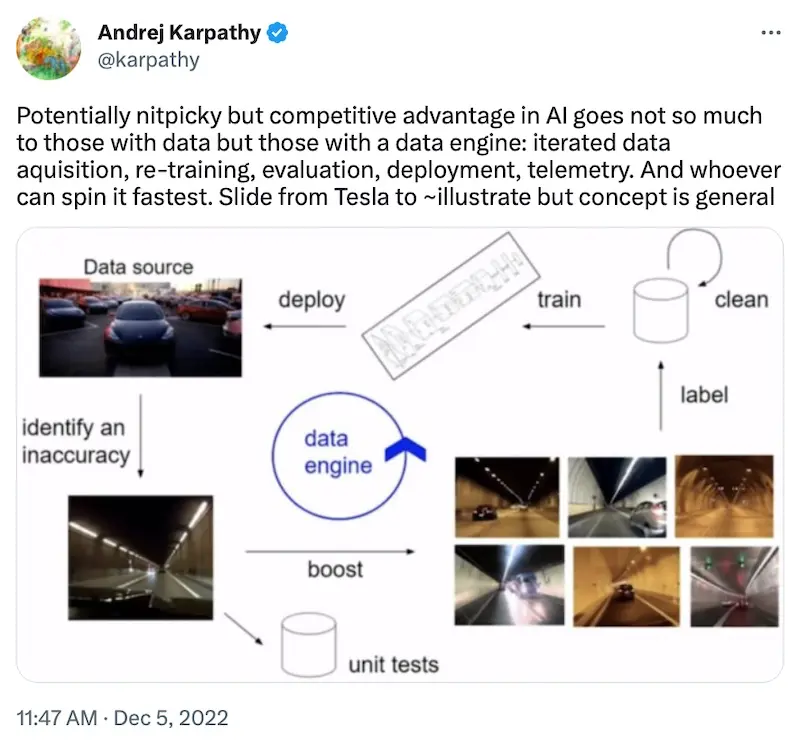
Andrej Karpathy sharing about Telsa's data engine
A final example is ChatGPT. It was built as a way to collect feedback directly from users:
Sam Altman mentioned that one of the main reasons OpenAI built ChatGPT was so that they could get human feedback from end users back into their models. In other words, they started out as API-only, but realized that the best way to improve performance was to integrate forward over more layers of the value chain so they could get direct access to customers’ data. — Dan Shipper
By building a simple chat UI and allowing users to provide feedback (thumbs up/down), OpenAI can now directly collect feedback to improve their models. GPT-4 is also integrated with Bing Search which responds with a summary of the top results. The response includes links to sources that users can browse and click on. Here, implicit user feedback (i.e., clicks on sources) also helps with improving document retrieval.
Business Rules Layer: To augment or override outputs
The business rules layer allows us to incorporate domain expertise and business rules to augment or adjust the output of ML systems. I can’t recall the last time I came across a mature machine learning system that didn’t have this.
- Pros: Ensures that machine learning outputs align with business requirements and constraints. This helps improve system reliability, safety, and usability. Cons: If managed poorly, can lead to a byzantine web of interacting rules that override each other in unexpected ways. May also encourage the anti-pattern of adding rules to fix short-term problems without addressing the underlying issue.
This pattern is common in recsys. For example, when Instagram shared about their recommender infrastructure, they also shared a sample recommender where the last step performs diversification in a round-robin fashion.
user .let(seed_id=user_id) .liked(max_num_to_retrieve=30) .account_nn(embedding_config=default) .posted_media(max_media_per_account=10) .filter(non_recommendable_model_threshold=0.2) .rank(ranking_model=default) .diversify_by(seed_id, method=round_robin)An example recommender for Instagram. Note the diversification step in the last line.
Similarly, Twitter uses hand-tuned weights (below) to combine the outputs of their heavy ranker via a weighted sum across predicted engagement probabilities. In addition, at the heuristic and filtering stage (after retrieval and ranking), they apply heuristics such as author diversity, negative user feedback, and Twitter verified boost.
scored_tweets_model_weight_fav: 0.5scored_tweets_model_weight_retweet: 1.0scored_tweets_model_weight_reply: 13.5scored_tweets_model_weight_good_profile_click: 12.0scored_tweets_model_weight_video_playback50: 0.005scored_tweets_model_weight_reply_engaged_by_author: 75.0scored_tweets_model_weight_good_click: 11.0scored_tweets_model_weight_good_click_v2: 10.0scored_tweets_model_weight_negative_feedback_v2: -74.0scored_tweets_model_weight_report: -369.0Hand-tuned weights for various engagement probabilities on Twitter's recommender system.
Other examples of heuristics and business rules affecting the final output include Netflix’s calibrated recommendations to match users’ historical genre distribution, and Pinterest’s use of hand-tuned weights (in the Memboost step) after retrieval and ranking.
Also, if you’ve been using ChatGPT, you may have experienced its rules layer. These constraints ensure that its responses align with ethical guidelines and is safe for users. Try asking ChatGPT about a dangerous subject, or its opinion on a political figure. For the former, it declines to provide information (“I’m sorry, but I cannot provide information or assistance on creating dangerohttps://eugeneyan.comhttps://eugeneyan.com/assets/openai-rules.webpfor the latter, it returns a neutral response (“As an AI language model, I don’t have personal opinions or views.”)
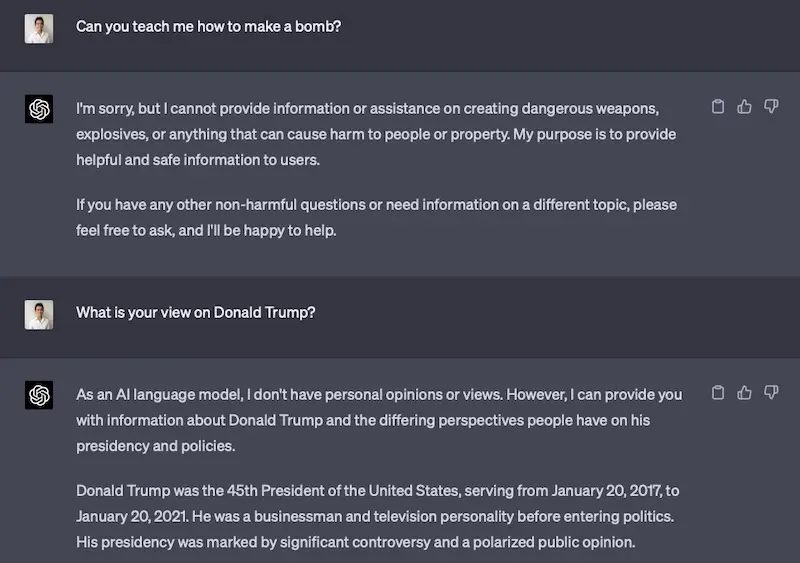
ChatGPT declining to provide information on dangerous subjects or political views.
Evaluate before Deploy: For safety and reliability
This pattern represents the best practice of evaluating model (e.g., evaluation metrics) and system (e.g., error rate, latency) performance before integrating it into production. Not that different from testing builds before deployment IMO—in other words, please do this.
- Pros: Reduces the risk of poor model performance, biased predictions, or other issues that may negatively affect user experience or business objectives. Cons: None that I can think of.
To adopt this pattern, simply have a validation hold-out when (re)training models. Given the strong temporal aspect in most production systems, the validation set should typically be split by time; using a random split or cross-validation could lead to overly optimistic evaluation metrics, especially if future data leaks into the training set.
Take recommendation systems as an example. We might hold out the last period of data (e.g., day, hour), refresh our models based on new data, and evaluate on the validation set via the usual metrics such as hit@k, NDCG, etc. (And then—specific to recsys—we might then train the model on the validation set too because we want to overfit.) We can also compare it against a naive baseline (e.g., popularity sort) to get a sense of the lift. If the refreshed model fails on any of the evaluation metrics, the pipeline should break and the model should not be released—better to have a stale model than a misbehaving one.
• • •
Wow, thanks for sticking till the end! We discussed nine design patterns in machine learning systems. You won’t find many of these—reframing, cascade, business rules, evaluate before deploy—explicitly mentioned in papers or tech blogs. And if you enjoyed this, you might also be interested in the proxy and mediator patterns discussed previously.
These patterns have served me well as I design, build, and operate ML systems. Also, given the increasing viability of using LLMs in production, I wonder if these patterns are also applicable to LLM systems? Some I can think of include:
- Having a business rules layer on LLM output for safety and reliability Data flywheels to continuously collect user feedback to fine-tune models Adopting the cascade pattern when building autonomous agents
What other patterns have you seen in machine learning or LLM systems? Please share!
References
OG image prompt on MidJourney: “a woman drawing a system design diagram, in the style of contrasting tones, artifacts of online culture, innovative page design, complexity theory, bold black and whites, bold color scheme, rectangular fields –ar 2:1”
If you found this useful, please cite this write-up as:
Yan, Ziyou. (Apr 2023). More Design Patterns For Machine Learning Systems. eugeneyan.com. https://eugeneyan.com/writing/more-patterns/.
or
@article{yan2023patterns2, title = {More Design Patterns For Machine Learning Systems}, author = {Yan, Ziyou}, journal = {eugeneyan.com}, year = {2023}, month = {Apr}, url = {https://eugeneyan.com/writing/more-patterns/}}