We had been flying for four hours, but both gas gauges still read “full.” I didn’t need a pilot’s license to know that couldn’t be right, nor to feel the rush of adrenaline in my gums at the thought of the engine sputtering to an eerie quiet death, propeller blades windmilling as we scream “mayday mayday” and “set it down over there” like in the movies, hopefully including the part where the heroes confidently stride away while the wreckage ignites in a fireball, such a banal event in their exhilarating life that they can’t even be bothered to glance back at the carnage.
“Umm, this can’t be right” I said to Gerry, the real pilot. “Yeah,” he said, “the needles get stuck to the glass.” He flicked the glass. The needle didn’t move. “So… do we have enough gas?” “Yeah, we have another hour, I stuck the tanks before we left.”
“Sticking” means plumbing a wooden dowl through top of the wing, into the gas tank, judging the gas level by the height of the resulting wetness. Sometimes the simplest technology is best. Wooden sticks don’t run out of batteries or make you wait forty-seven minutes for a security update.
Trust, but verify.”—Ronald Regan, repeating a Russian rhyming proverb: Доверяй, но проверяй
It’s not even good enough to just have “two of everything.” If two things both rely on electricity, and the electricity goes out, you lose both. There were two gas gauges; both failed for the same reason. It needs to be differently-implemented as well, like a stick versus a gauge. For example, there’s a normal magnetic ball compass floating in liquid that will work even if other power sources fail, but it’s hard to read as it bounces around from the vibration so it’s good to have another one that runs off suction—air pressure differential between the outside and inside of the cabin—which is stable even when you’re turning the plane in turbulence.
Gerry used to say: “Who’s lying?” Usually your instruments are correct, but sometimes one is lying. Maybe the suction system isn’t working, so you double-checking suction-based dials with the electric-based dials. You stick the tank, in case the gas gauge is lying.
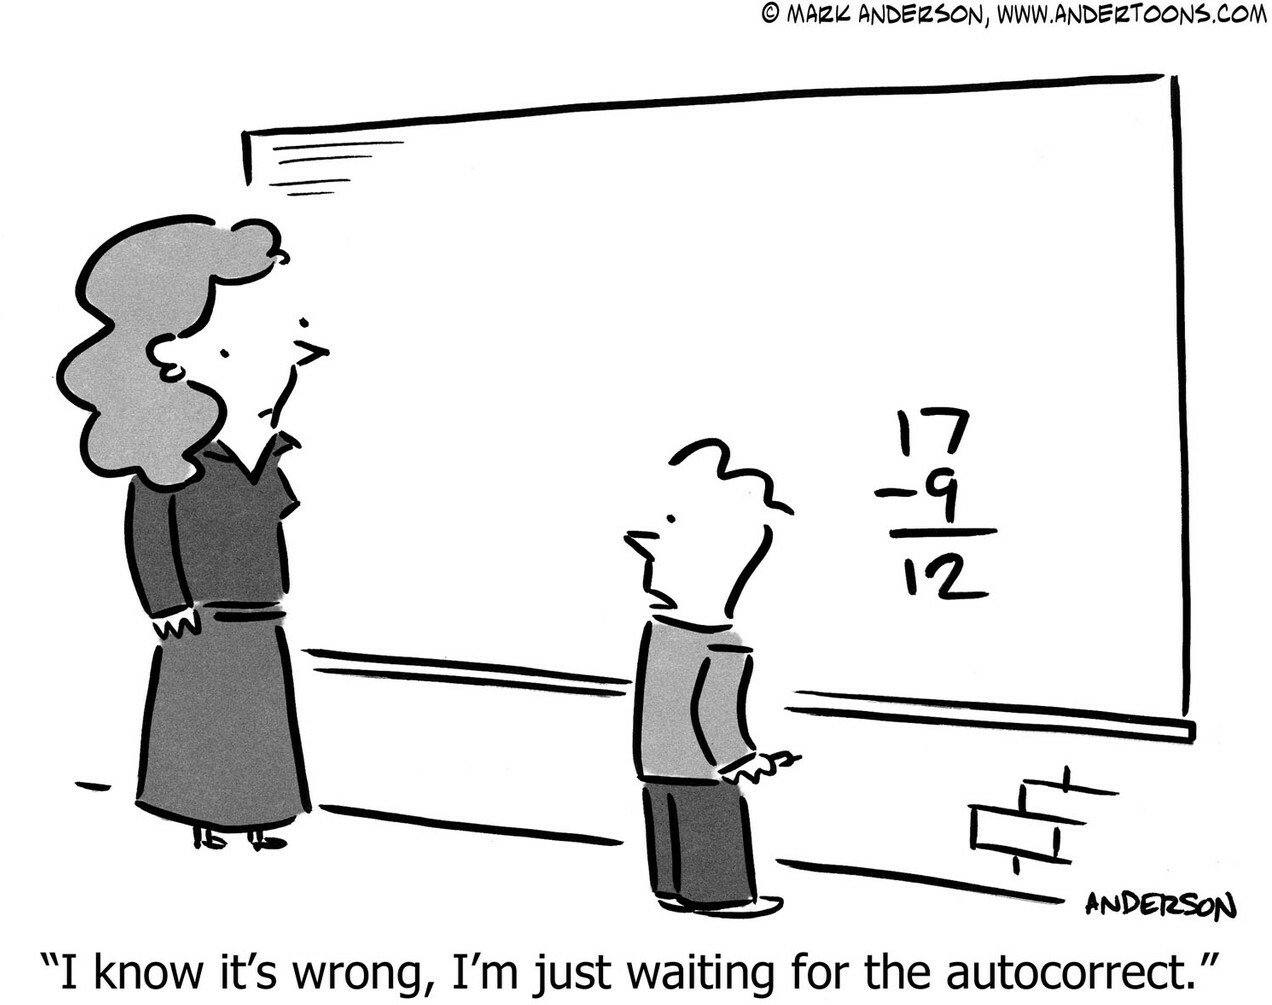
The same lesson applies to our daily life of data and metrics. You think you understand what each number means, and usually you’re correct. But sometimes you’re running out of gas and don’t realize it. I’ve seen this happen for all sorts of reasons: The spreadsheet had a subtle bug in a formula, the analytics JavasScript code was accidentally left off one page, the survey email didn’t get sent to all the customers in the cohort, the database query did/didn’t filter something important, a nightly update script hasn’t been running for three months.
A good way to check for bad data is to replicate the airplane dashboard method of deriving the same information in two different ways. Revenue from your billing system compared to cash flows from your bank statements. (Once I discovered our credit card processor was delaying our cash receipts.) Number of active customers from Stripe, and from your User Portal. (Because sometimes a cancellation in one system fails to cancel in another system.) Web traffic from Google Analytics but also another analytics system, or your raw web logs. (If you use five web analytics tools, they’ll all give you different numbers; this could be due to differences in definitions of things like “visit” and “session,” but is that truly all it is?)
Besides paranoia, I’ve found another advantage in computing the same data twice: a better understanding of the forces behind that data, and therefore better analysis of how the company operates and how the market is changing. Consider web traffic. There are analytics that tell you where traffic originates (imperfectly, especially with the latest browsers and extensions intentionally obscuring or blocking data), data about your advertising click-throughs, your own raw web server logs, and broad industry data (e.g. Google Trends on how search-traffic for your keywords is changing). They all tell a different story. None has the full picture; all are biased. But taken together, your picture of the world is more complete, and biases might be cancelled through averaging or by paying heed only to the clearest, most consistent trends. If four different sources agree that a trend is happening, then it’s definitely happening.
If a metric is important enough to watch it every day, and to act if its behavior deviates from expectation, then it’s important enough to be double-checked. Both for accuracy, and for completeness of comprehension.
If your dashboard isn’t redundant, you’ll never know… who’s lying?
The post Who’s lying? appeared first on @ASmartBear.


