
We have updated Neural Network Console Windows today.
In this version, plug-ins are now available for post-processing evaluation results.
To use the plug-in, right-click the evaluation result of the EVALUATION tab to open a shortcut menu, and click Plugin.
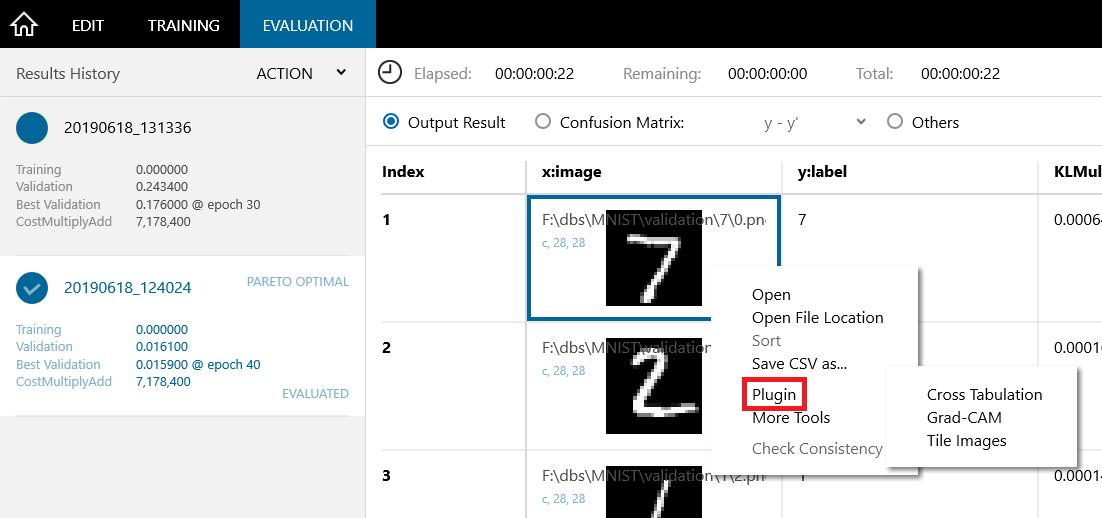
The four plug-ins added this time are introduced below.
Grad-CAM
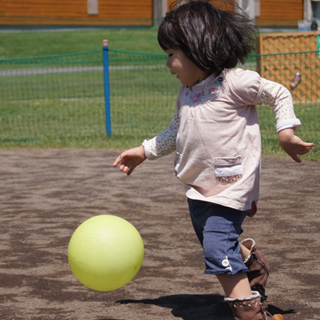
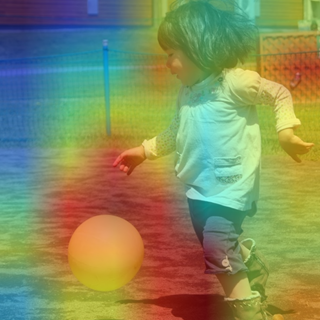
Grad-CAM (*1) is one of the popular methods for visualizing input data that greatly affects recognition results.
To use Grad-CAM,
- Run training and evaluation in image recognition project using Convolutional Neural NetworksSelect the evaluation image displayed on the EVALUATION tabRight-click the evaluation result of the EVALUATION tab to open a shortcut menu, and select Plugin and Grad-CAM.Specify the index of the class to be visualized in class_index (for example, 0 to 999 for 1000 class classification)
To display a larger view of the Grad-CAM result image, double-click the result image displayed on the EVALUATION tab.
Cross Tabulation
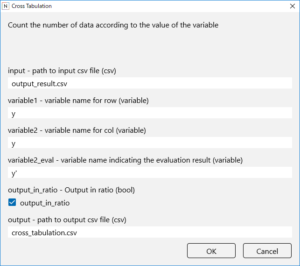
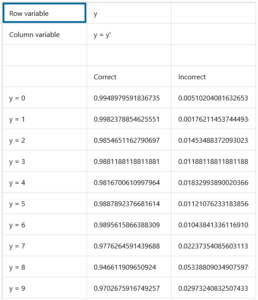
Perform cross-tabulation analysis the evaluation results.
For example, cross tabulation can be used to compare the accuracy of each class in a classification tasks.
Specify the variable name used for the row of the tabulation result in variable1 and the variable name used for the column in variable2.
To use correct / incorrect between the label and the estimation for the column, specify the variable name to be compared with variable2 in valuable2_eval.
Parameter Stats
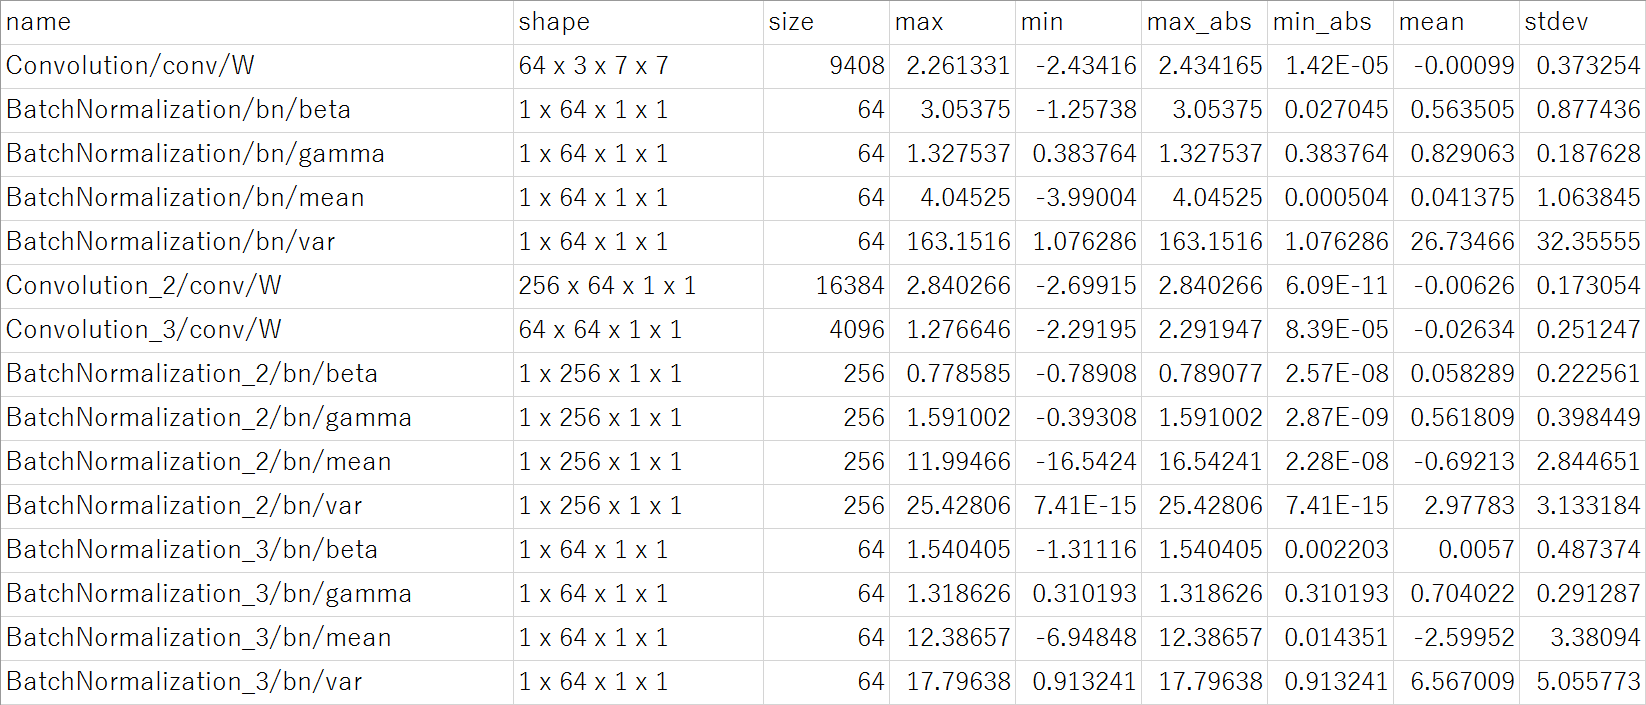
Displays various statistics (minimum, maximum, mean, standard deviation, etc.) for model parameters.
The following is an example of using statistics of parameters.
- Check whether the parameter value is within the quantifiable range when performing parameter quantization at inferenceSet the minimum value (Delta) for quantization when performing parameter quantization at training
Tile Images
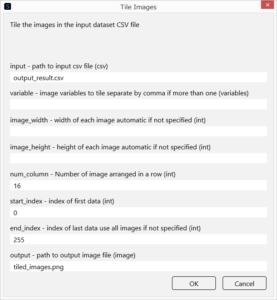
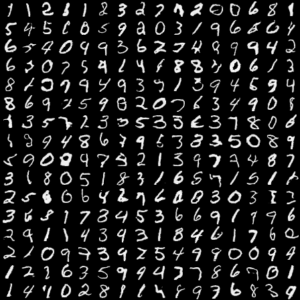
The images included in the evaluation data are tiled as a single image.
For example, it can be used to tile the images generated by using a method such as GAN.
Specify the number of images to be arranged in row in num_column, and the index of the first and last images in start_index and end_index.
To display a larger image of the result, Double-click the result image displayed on the EVALUATION tab.
You can easily add your own plug-ins by creating an executable Python script from the command line.
Please refer to the existing plug-in files in the libs/plugins folder for how to make plug-ins.
The created plug-in can be called from Neural Network Console by copying it to the libs/plugins folder.
In addition, several other layers and solvers have been added.
- GELU
ReLU6
HardSigmoid
HardTanh
LogSigmoid
SoftPlus
SoftSign
TanhShrink
Tile
ATan2
FusedBatchNormalization
AdaBound
AMSBound
We will continue to improve Neural Network Console.
We look forward to hearing feedbacks from the users for further improvements!
Neural Network Console Windows
https://dl.sony.com/app/
※1
Grad-CAM: Visual Explanations from Deep Networks via Gradient-based Localization
Ramprasaath R. Selvaraju, Michael Cogswell, Abhishek Das, Ramakrishna Vedantam, Devi Parikh, Dhruv Batra
https://arxiv.org/abs/1610.02391
